Category: Blog

NAEMA East Meets West 2025

NAEMA East Meets West 2025

REsurety will be attending the conference in Vail, CO.

NAEMA East Meets West

REsurety’s CEO, Lee Taylor, and Owen Glubiak, VP of Business Development, will be attending NAEMA East Meets West 2025 from January 28 – 31 in Vail, CO. Book a meeting with us at the conference here.

Owen Glubiak
Owen Glubiak
VP, Business Development

About the conference

Since 2011, when Xcel Energy launched the event then known as “Face Plant,” this gathering has become a cornerstone for energy professionals. The North American Energy Markets Association (NAEMA) is proud to continue this legacy with NAEMA’s East Meets West 2025, hosted by Xcel Energy at the Hythe in Vail, Colorado.

Set in the iconic mountain town of Vail, this year’s event combines industry insights with the unique backdrop of a community rich in history and alpine culture. Founded in 1962, Vail was established by World War II veterans from the 10th Mountain Division who trained in the nearby mountains. Drawn by the area’s pristine slopes and scenic beauty, they transformed it into a premier ski destination that would grow into one of North America’s largest ski resorts. Over the decades, Vail has retained its spirit of adventure while expanding to include world-class dining, shopping, and year-round outdoor activities.

The Hythe, a luxury resort inspired by Vail’s skiing legacy, offers an ideal venue with mountain views, après-ski lounges, and an adventure concierge ready to guide guests through the area’s rich landscape. Join NAEMA members and industry leaders from across the U.S. and Canada in Vail to advance NAEMA’s mission of fostering a dynamic and thriving energy marketplace.

Return to the event page main menu.

Q3 2024 State of the Renewables Market Report

A view of Q3 2024 U.S. renewable energy performance

REsurety Q3 2024 State of the Renewables Market Report

REsurety creates the State of the Renewables Market report every quarter to provide readers with data-driven insight into the value and emerging trends of renewable generation in U.S. power markets. Please fill out the form to access the full report, the Editor’s Note is below.

Editor’s Note:

Maha Mapara, REsurety
Maha Mapara
Analyst
Senior Analyst,
Analytics Services
REsurety's Devon Lukas
Devon Lukas
Lead Analyst
Associate,
Analytics Services
Adam Reeve
Adam Reeve
Editor
SVP,
Customer Experience

AI Introduces Unprecedented Power Needs: How Will Clean Energy Markets Be Impacted?

The landscape of U.S. power markets is being dramatically reshaped by an unprecedented wave of data center development, driven largely by artificial intelligence (AI) and cloud computing demand. The headlines are alarming: hyperscalers are announcing tens of billions of dollars of investments this year in data center infrastructure, ISOs are forecasting supply shortfalls and/or reliability concerns, and load forecasts are off the charts relative to historical growth rates.1-3

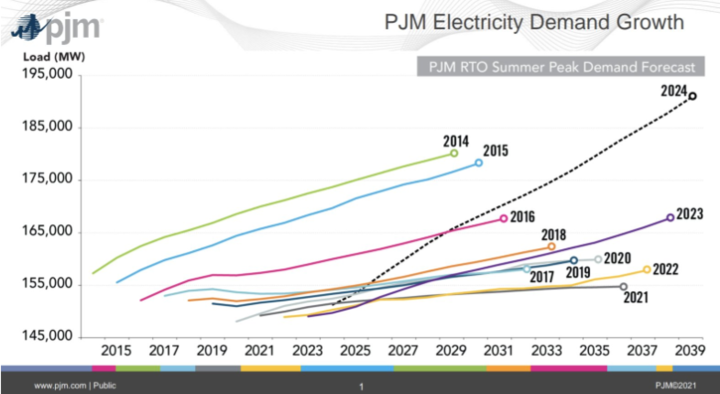
Figure 1: PJM demand growth forecast over time. Source: PJM.

With a historically reliable power supply and low-latency fiber network, the PJM region is currently a priority for digital infrastructure development – with more than 4GW already in Northern Virginia alone. PJM’s latest load forecast report forecasts a 1.6% annual growth rate for summer peak demand and 1.8% for winter peak demand, represented in Figure 1. Both growth rates are multiples larger than what we have seen historically, doubling from the estimates released last year with data center growth cited as a major contributor.

To put these numbers into perspective, summer peak demand in PJM is expected to increase above this year’s peak by almost 42GW in 2039 – representing a 28% increase. The winter peaks are forecasted to be 31% higher than last winter’s. This dramatic expansion puts grid reliability at risk, and also limits coal retirements in the next few years.2

What does this all mean for clean energy buyers or investors trying to plan for the future? Our guidance has generally fallen into one of three categories:

First, start with the historical facts on the ground.

All too often, we see forecasts – whether about future power prices, intra-day price volatility, wind/solar capture rates, congestion and curtailment, or emissions impacts – that are disconnected from historical realities. We find that this sort of discontinuity is very rarely warranted in power markets, even in a time of accelerated change (such as today).

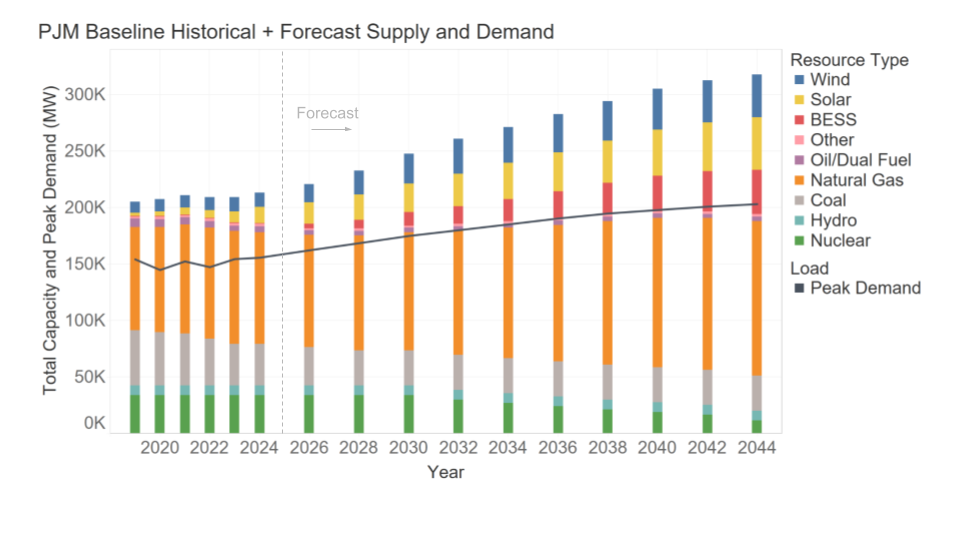
Figure 2: Historical and Forecasted PJM Generator Capacity and Peak Load.
Figure 2: Historical and forecasted PJM generator capacity and peak load.

Figure 2 shows the historical and REsurety’s forecasted generation supply (colored bars) and peak load (line) in PJM. While the market will be tight over the next few years, after that we expect load growth to be more balanced with supply growth.

The result of this will be elevated prices in peak winter and summer months over the next few years, followed by smoother seasonal profiles in later years. Overall, our forecasted PJM power pries are increasing over the next 20 years in all of our modeled scenarios.

Second, get back to fundamentals.

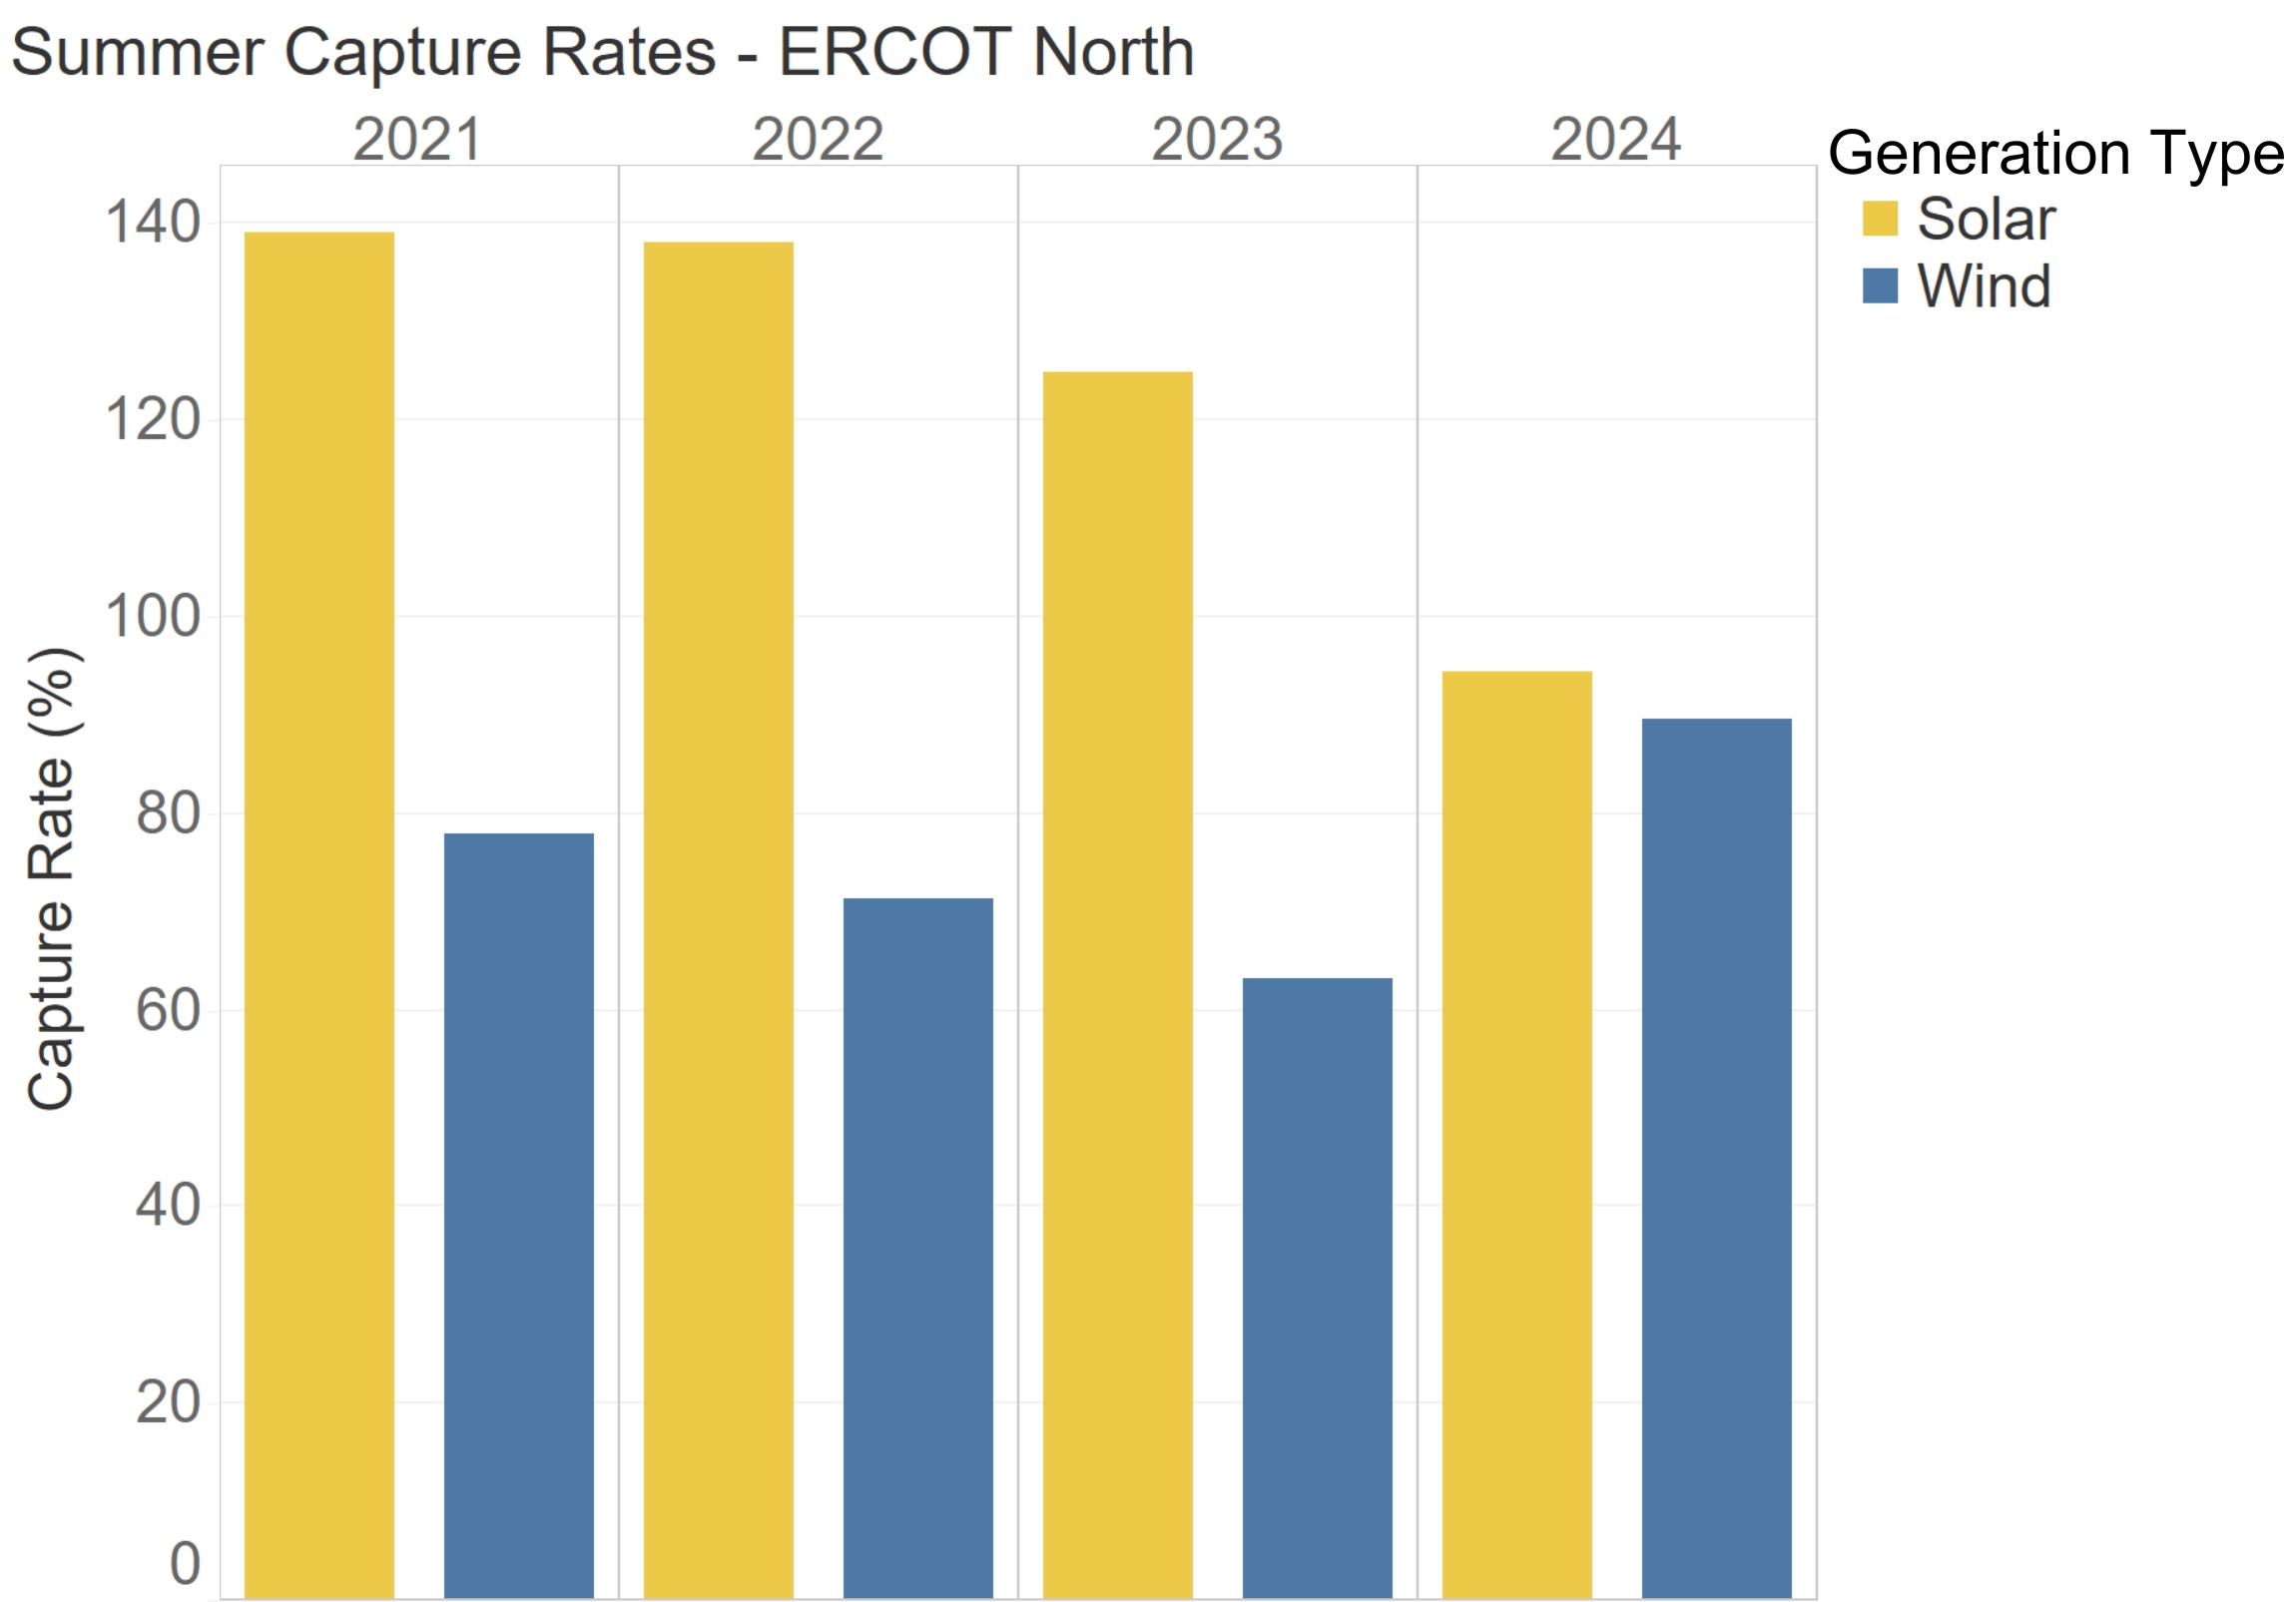
While AI-driven load growth is a new variable to consider when evaluating the future, it is not the only variable in power markets. Fuel prices, renewable energy penetration, hourly weather conditions, and congestion continue to dominate the value story for renewables, and likely will for some time. Consider solar capture rates in ERCOT this summer: while ERCOT set a new peak load (thanks in part to the 7+ GW of data centers in Texas), the summer capture rate for solar projects in Q3 hit a record low, dropping below 100% for the first time ever due to the rapid continued buildout of solar in Texas (Figure 3). Wind capture rates, meanwhile, have actually increased, as solar balances out the renewable mix. Our forecasts see this trend continuing into the future, with the average solar capture rate over the next decade at ~60%, as solar penetration continues to increase in ERCOT.

Figure 3: Summer solar and wind capture rates in ERCOT North.

Third, do not underestimate the impact of transmission.

This is relevant to multiple areas in the era of AI load growth. Data centers are increasingly struggling to get load interconnection agreements in place, causing delays and/or relocations of planned investments. This is already acting as a brake, all else equal, slowing AI-driven load growth. Additionally, congestion is on the rise, resulting in renewables getting bottlenecked and becoming undeliverable to load.

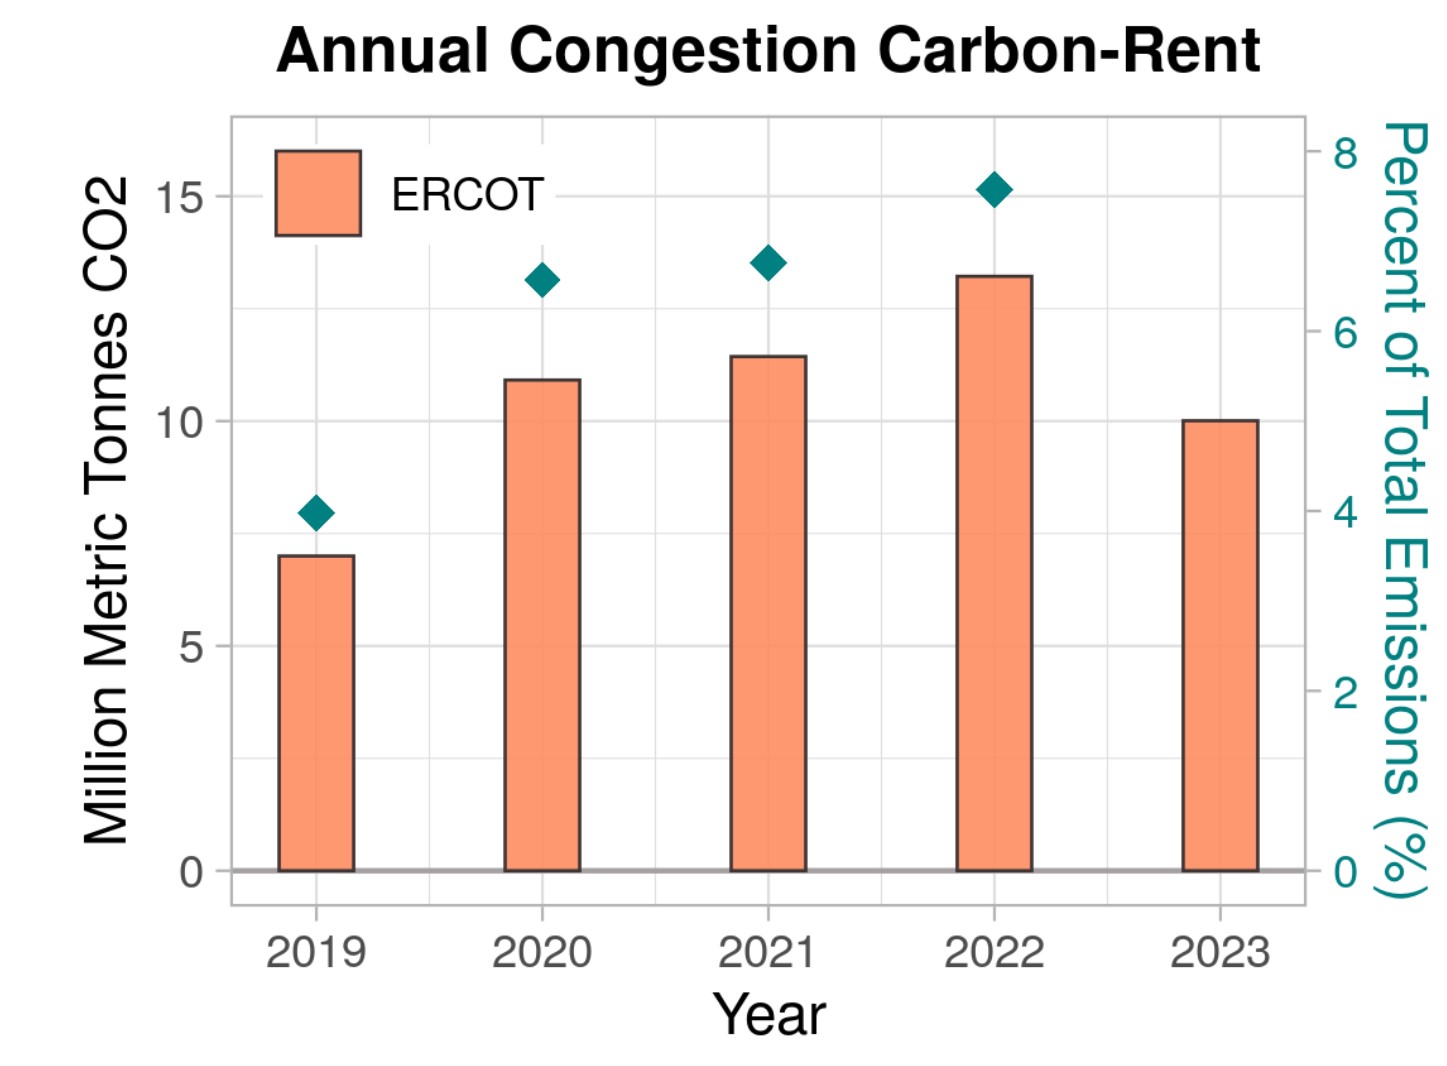
This has both financial and environmental implications: project owners and corporate offtakers with basis-sharing provisions will be financially impacted, and the emissions benefit of the clean generation will be significantly reduced. Our recent study found that 10 million metric tonnes of CO2e were emitted in ERCOT alone last year as a consequence of transmission congestion (Figure 4).4 When developing a clean energy purchasing strategy, accurately evaluating the “deliverability” of the generated clean energy is an increasingly critical consideration.

Figure 4: Calculated ISO-wide congestion carbon-rent.

The intersection of AI-driven load growth and clean energy development presents unprecedented opportunities, but success demands strategies grounded in historical data, fundamental market drivers, and realistic infrastructure constraints – and not over-reacting to headline growth numbers. At REsurety, we remain committed to providing the analytical tools and expertise needed to navigate these complexities and make informed decisions in this rapidly evolving market landscape.


Sources:
1. Bain & Company. Technology Report 2024. https://www.bain.com/globalassets/noindex/2024/bain_report_technology_report_2024.pdf, 2024.
2. PJM Resource Adequacy Planning Department. PJM Load Forecast Report. https://www.pjm.com/-/media/library/reports-notices/load-forecast/2024-load-report.ashx, 2024.
3. Gelles, D. A.I.’s Insatiable Appetite for Energy. https://www.nytimes.com/2024/07/11/climate/artificial-intelligence-energy-usage.html, 2024.
4. Sofia, S.; Dvorkin, Y. Carbon Impact of Intra-Regional Transmission Congestion. https://resurety.com/carbonimpact/, 2024.

Q3 2024 Report Download

"*" indicates required fields

Name*
This field is for validation purposes and should be left unchanged.

Return to the blog post main menu.

Blog Post: Quantifying the Accuracy of Commonly Used Marginal Emissions Data

Nodal granularity matters

Authored by Adam Reeve, SVP, Customer Experience, REsurety

Adam Reeve
Adam Reeve
SVP,

Customer Experience

Two common questions that REsurety gets about its Locational Marginal Emissions (LME) data are: “How accurate is it? How does it compare with other emissions data sources?”

Answering these questions is important because more and more companies are shifting their electricity decarbonization strategy to maximize emissions impact, for example through building or purchasing power from renewables in higher-impact locations. Research1-7 has shown that this strategy can enable faster and more cost-effective decarbonization relative to alternative approaches. At REsurety, we’re proud that our emissions data helps drive this sort of impactful action.

As our LME data and other emissions data sets get increasingly relied upon to guide decarbonization strategies, validating these emissions data sets becomes of growing importance. That’s why we teamed up with researchers at WattTime to study the accuracy of a number of different emissions data sets against real-world emissions impacts.

In this paper, Validating Locational Marginal Emissions with Wind Generation, the authors quantify, for the first time, the accuracy of a number of different commonly used models for estimating the emissions impacts of consumption or generation. The study uses granular data from wind farms in Texas to evaluate how changes in generation result in real-world changes in emissions on the grid.

At REsurety, we are particularly excited to see that the study found that our LME model performed the best across key metrics of accuracy, including best correlation and lowest margin of error. The paper also found that nodal granularity matters: the accuracy associated with using nodal data can result in up to 50% higher impact than lower-resolution models. While data granularity will vary around the world for a number of reasons, this underscores the importance of using nodal data in markets where it is available (which includes all U.S. ISOs).

If you are interested in getting access to this data to more confidently make impactful clean energy decisions, reach out to us at https://resurety.com/contact/.

Image: Quantifying the Accuracy of Commonly Used Marginal Emissions Data - Nodal granularity matters

1 https://www.sciencedirect.com/science/article/abs/pii/S1040619021001196
2 https://www.pnas.org/doi/10.1073/pnas.1221978110
3 https://www.nber.org/papers/w18462
4 https://www.jstor.org/stable/26544571
5 https://dl.acm.org/doi/pdf/10.1145/3447555.3466582
6 https://www.sciencedirect.com/science/article/abs/pii/S0959652616322065
7 https://pubs.acs.org/doi/abs/10.1021/es505027p

Return to the blog post main menu.

Green New Perspective: Climate Tech Podcast

Green New Perspective REsurety

The $50B Clean Energy Problem Nobody Talks About (Until Now)

Green New Perspective: Climate Tech Podcast - The $50B Clean Energy Problem Nobody Talks About (Until Now)

In this conversation with New Perspective’s Dunja Jovanovic, Lee Taylor, founder and CEO of REsurety, discusses the company’s mission to accelerate the transition to a zero carbon future through innovative software and services for the clean energy ecosystem.

He highlights the challenges in clean energy trading, the introduction of CleanTrade as a solution, and the importance of transparency and liquidity in the market.

Additionally, Taylor shares insights on marketing strategies and the significance of measuring impact in decarbonization efforts.

Listen to the full podcast here.

Key Takeaways:

  • REsurety is focused on a zero carbon future.
  • CleanTrade addresses the lack of transaction platforms in renewables.
  • The clean energy market needs more transparency and liquidity.
  • Intermittency is a key challenge for wind and solar energy.
  • End-to-end workflows are essential for efficient transactions.
  • Marketing efforts include direct engagement and social media outreach.
  • Understanding carbon impact is crucial for effective decarbonization.
  • Real-world decarbonization must match corporate claims.
  • Investors need to optimize their impact in clean energy projects.

Return to the main menu of podcasts, or return to the blog post main menu.

Carbon Impact of Intra-Regional Transmission Congestion

Solar Energy Power Grid

Authored by: Sarah Sofia, REsurety, and Yury Dvorkin, Johns Hopkins University with contributions from Devon Lukas, REsurety


Derived from the scientific paper: Carbon Impact of Intra-Regional Transmission Congestion, which received unanimous support from the ZEROgrid Independent Advisory Initiative advisors (MIT Energy Initiative, Princeton, WattTime, and REsurety). To access the study, please scan the QR code.

Overview

The emissions intensity of electricity can vary greatly within grid regions at any given time due to transmission congestion, yet current environmental policies and carbon accounting frameworks typically ignore these differences. By overlooking transmission constraints, these policies risk increasing system-wide emissions and worsening grid congestion, even when consumption and carbon-free energy are matched hourly. A notable portion of new wind and solar capacity proposed for ERCOT and PJM is planned in areas with substantial congestion (Fig. 1), but without significant transmission expansion, these projects will exacerbate congestion and limit emissions reduction. Through several case studies, we find that congestion-aware emissions metrics, such as Locational Marginal Emissions (LMEs), can more accurately measure the carbon impact of clean energy procurement and enhance market signals to support better grid planning and procurement strategies.

Key takeaways:

  1. Transmission congestion has a significant impact on price and emissions for the power grid.
    a. For example, in 2022, transmission congestion in ERCOT increased system cost by $2.8 billion and system emissions by 13 million tonnes CO2e, which is 8.7% and 7.5% of the system total respectively.

  2. In the same grid at the same hour, different locations frequently observe a difference in emission intensity of hundreds of tonnes of CO2e due to transmission constraints.
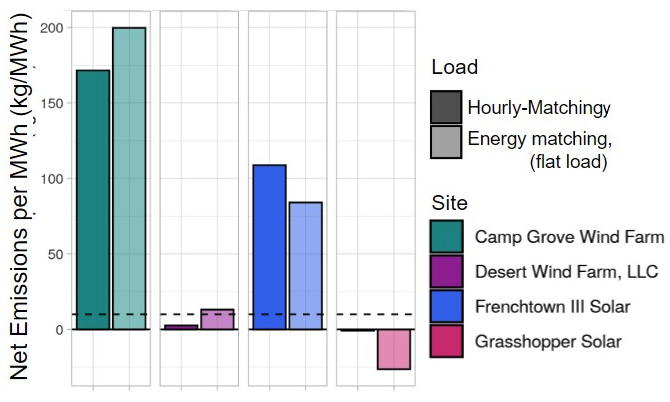
    a. Even 100% hourly matched consumption with clean energy is often not carbon-free and, in many instances, hourly matching can actually increase operational emissions relative to annual matching (Fig. 2).
    b. Hydrogen production that complies with the current proposed 45V criteria will often significantly increase real-world emissions.

  3. Current carbon accounting methods overestimate emissions reductions by overlooking intra-regional transmission congestion.
    a. Granular emission data, such as Locational Marginal Emissions rates, incorporate transmission impact, providing a more accurate measurement of the real-world carbon impact of grid connected projects.

  4. Transmission planning and infrastructure expansion must be accelerated to achieve the decarbonization potential of renewable energy development.
    a. Clean energy procurement that utilizes marginal emissions rates to inform citing will better incentivize the development of projects in areas of uncongested transmission.
Figure 1:  Contour map of 2023 average LME by county across ERCOT and PJM, with the combined wind and solar interconnection queue for each county (gray circles) overlaid.

Figure 1:  Contour map of 2023 average LME by county across ERCOT and PJM, with the combined wind and solar interconnection queue for each county (gray circles) overlaid.

Scope 

This work uses nodal LME data for the past five years in ERCOT and PJM to quantify the effects of congestion on carbon emissions and the efficacy of annual- and hourly- matching carbon accounting frameworks. The impact of intra-regional congestion is shown to be a vital component of effective carbon accounting methods and complementary policies, and policy proposals that frequently overlook this impact risk significantly increasing real-world emissions despite the operational and cost burdens of compliance with hourly matching.

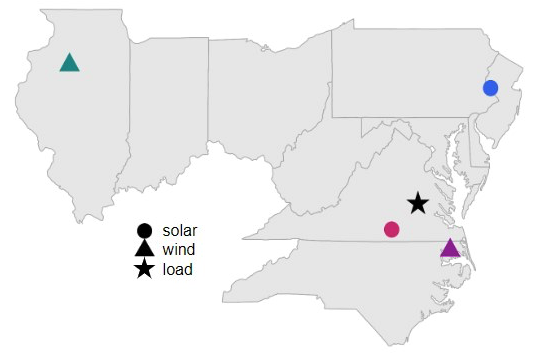
Figure 2: Map of load and procured power from four different renewable project options in PJM; 2023 net emissions from matching scenarios where both rigorously hourly-matched load through load-shifting and 100% annually-matched flat load have significant net emissions.

Figure 2: Map of load and procured power from four different renewable project options in PJM; 2023 net emissions from matching scenarios where both rigorously hourly-matched load through load-shifting and 100% annually-matched flat load have significant net emissions.

Assuming equal emissions and perfect generation deliverability within a grid region misses a major factor in determining the induced and avoided carbon emissions, respectively, of load and renewable generation. The induced emissions of a newly built load could be reduced by hundreds of kgCO2e/MWh just by siting it in Eastern Pennsylvania instead of Virginia, for example, and a Virginian wind farm could avoid 50% more carbon than an equivalent farm in Northern Illinois. Prioritizing and incentivizing the development of new renewable projects in less congested regions could meaningfully expedite grid decarbonization, and avoid the exacerbation of already existent congestion-driven deliverability issues.

Return to the resources main menu.

3 Ways to Maximize the Effectiveness of Your Renewable Energy PPAs

3 Ways to Maximize the Effectiveness of Your Renewable Energy PPAs

A playbook by REsurety, published by Utility Dive

3 Ways to Maximize the Effectiveness of Your Renewable Energy PPAs

To help meet their sustainability goals, more and more companies are signing clean energy power purchase agreements (PPAs). While long-term contracts such as PPAs can help companies hedge price risk in the long term, they may also result in significant short-term losses if not designed and monitored carefully.

Unfortunately, many corporate renewable energy buyers lack the teams or tools to carry out this kind of due diligence. But with the right mix of human expertise and purpose-built tools, companies can minimize risk and maximize the effectiveness of their PPAs.

This playbook outlines three key steps clean energy buyers should take to evaluate, monitor, and build an effective clean energy portfolio. You’ll learn how to:

  • Successfully monitor a project’s financial and operational performance
  • Forecast settlement payments to avoid costly surprises
  • Ensure that project locations and technology types align with your sustainability goals

Fill out the form below to access the full playbook.

"*" indicates required fields

Name*
This field is for validation purposes and should be left unchanged.

Return to the resources main menu.

REsurety Launches First-of-its-Kind Clean Energy Marketplace

Lee Taylor

The newly established business unit complements industry-leading intelligence platform and is powered by a $32M Series C funding led by S2G and Citi

REsurety's founder and CEO, Lee Taylor: "We are grateful for the support of our new investors and partners at S2G and Citi and look forward to continued collaborative success."
Lee Taylor
Founder and CEO
REsurety

BOSTON, Mass. – October 15, 2024 – REsurety, Inc., a mission-driven organization dedicated to accelerating the world’s transition to a zero-carbon future, today announced the launch of its first-of-its-kind, scalable transaction marketplace to empower and accelerate the clean energy transition: CleanTrade. The new marketplace has been funded by the company’s recent Series C raise, led by S2G Ventures (“S2G”), a multi-stage investment firm focused on venture and growth-stage businesses across energy, food, agriculture and oceans, and Citi with participation from Angeleno Group and existing investors. 

Until now, clean energy did not have access to a scalable trading platform or marketplace. As a result, clean energy procurement, trading and risk management have remained opaque, slow and inefficient – both financially and environmentally. The CleanTrade marketplace is a platform for buyers, sellers and traders to provide price transparency and facilitate end-to-end transaction workflows for financially settled contracts for clean energy, or virtual power purchase agreements (VPPAs). Contingent upon approval by the Commodity Futures Trading Commission (CFTC), CleanTrade will provide the first CFTC-compliant marketplace for clean energy, known as a Swap Execution Facility (SEF), and in doing so will empower clean energy markets with price transparency and liquidity as well as end-to-end workflows of structured negotiation, on-platform execution and compliance reporting. It is the only existing platform that allows users to rank trades in terms of what is most and least attractive by the implied cost of the carbon abated, supporting a continued commitment to operationalize the Emissions First Partnership’s principles. In addition to this newly created SEF, CleanTrade supports physical power purchase agreements (PPAs) and project-specific renewable energy certificates (RECs).

“CleanTrade fills a critical gap in the energy transition’s toolkit, providing the level of price transparency and transaction liquidity that traditional energy has long benefited from but which clean energy markets have sorely lacked,” said Lee Taylor, REsurety’s founder and CEO. “REsurety has a long history of empowering great decisions with data and insights – and with this new offering we now make those decisions actionable at scale. We are grateful for the support of our new investors and partners at S2G and Citi and look forward to continued collaborative success.”

CleanTrade complements REsurety’s existing software platform, CleanSight, an industry leader for insight into clean energy assets and contract performance. CleanSight offers an integrated suite of clean energy software solutions, enhanced by support from REsurety’s deep domain experts, that buyers, sellers and investors have long trusted to identify opportunities and risks, evaluate projects and manage their operational portfolios. Both platforms share the same goal of empowering customers to confidently deploy capital to the highest impact opportunities in the market through transparency, liquidity and impact.

“At S2G, we are committed to supporting innovations that can help accelerate the clean energy transition, and we believe REsurety and its CleanTrade marketplace represent a game-changing platform in this regard,” said Francis O’Sullivan, managing director at S2G. “Our view is that by providing enhanced price transparency and liquidity, CleanTrade can help reduce the barriers to customer adoption of clean electricity and in turn, this will help support further deployments of clean electricity production capacity.”

O’Sullivan has joined REsurety’s board of directors.

The development of CleanTrade’s innovative digital platform initially grew from Citi’s Commodities division in Markets. CleanTrade is a great demonstration of Citi’s innovation strategy to identify market problems and develop solutions that drive market opportunity and serve clients.

“With REsurety and Citi’s long-standing partnership, it was a natural fit for REsurety to take this on, further develop the platform, and provide the clean-energy economy with a robust diverse product offering,” said Siris Singh, global head of markets strategic investments at Citi.

Contact us to learn more about REsurety.

REsurety’s Founder and CEO Lee Taylor Introduces CleanTrade

About REsurety

REsurety is a mission-driven organization dedicated to accelerating the world’s transition to a zero-carbon future. We provide software and services to support both the financial and sustainability goals of clean energy buyers, sellers, and investors. Our software offers data-driven insights at various stages of the project lifecycle from initial exploration to portfolio management. Our services leverage our domain expertise and deliver solutions tailored to the unique needs of our customers. For more information, visit www.resurety.com or follow REsurety on LinkedIn.

About S2G Ventures

S2G is a multi-stage investment firm focused on venture and growth-stage businesses across energy, food, agriculture, oceans and energy. The firm provides capital and value-added resources to entrepreneurs and leadership teams pursuing innovative market-based solutions that S2G believes are cheaper, faster or better than traditional alternatives. With a commitment to creating long-term, measurable outcomes, S2G structures flexible capital solutions that can range from seed and venture funding through growth equity to debt and infrastructure financing. For more information about S2G, visit s2gventures.com or connect with us on LinkedIn.

Media Contact
Tara Bartley
[email protected]

Download a PDF version of the press release.

Blog Post: Putting Our Forecasts to the Test

Continually providing value to our customers

Authored by Ryan Gao, Senior Research Associate, REsurety

Ryan Gao
Ryan Gao
Senior Research Associate

Background

At REsurety, our Weather-Smart forecasts provide customers with hourly prices and carbon impact data over the coming 20 years. These hourly forecasts are provided across a variety of weather conditions based on the past 40 years as well as five different market fundamentals scenarios. As of the end of 2023, we have made Weather-Smart forecasts available across all seven deregulated ISOs in the United States. To assess the quality of our Weather-Smart forecasts, we put our forecasts through a reality check and compared how they were performing for the first half of 2024 against observed prices and market forwards. This comparison indicated that the forecasts are fundamentally sound and highlighted the importance of providing forecasts across a variety of weather and fundamentals scenarios. Specifically, the Q4 2023 Low Gas scenario forecast produced a very close price prediction, largely because the gas price inputs used for the first half of 2024 were very close to the realized gas prices. Overall, our forecasts provide a wide variety of weather conditions and different fundamental scenarios, which deliver immense value to our customers by reflecting the uncertainty inherent in price predictions.

Monthly ATC Power Price Comparison

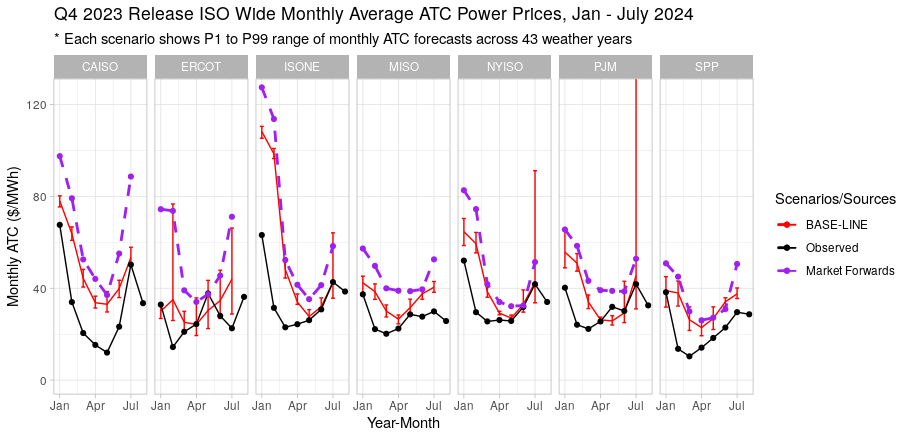
A closer look at the monthly around-the-clock (ATC), or average, power prices has shown that our forecasts in the Baseline fundamentals scenario, depicted in the red curves here, are lower than the OTC Global Holdings (OTCGH) power forwards, depicted in the purple curves. While REsurety’s Baseline predictions were lower than the OTCGH power forwards, both REsurety’s Weather-Smart forecasts and the OTCGH forwards were higher than the observed ATC prices during most months in the first half of 2024. However, our Baseline predictions are actually closer to the observed ATC prices. With that said, our forecasts were lower for a good reason. When considering why both our forecasts and the OTCGH power forwards were higher than the actual observed ATC prices, the biggest driver is gas prices. Back in 2023, the predicted gas prices for the first half of 2024 were significantly higher than what was actually realized. This was driven by a variety of factors including the geopolitical development in Europe and also the outlook for more extreme weather conditions based on what took place last year. However, actual gas prices were much lower than what was predicted back in 2023 due in part to the relative cooling of the geopolitical situation, and milder weather in the first half of 2024.

How Are Our Forecasts Doing Figure 1

Monthly Gas Price Comparison

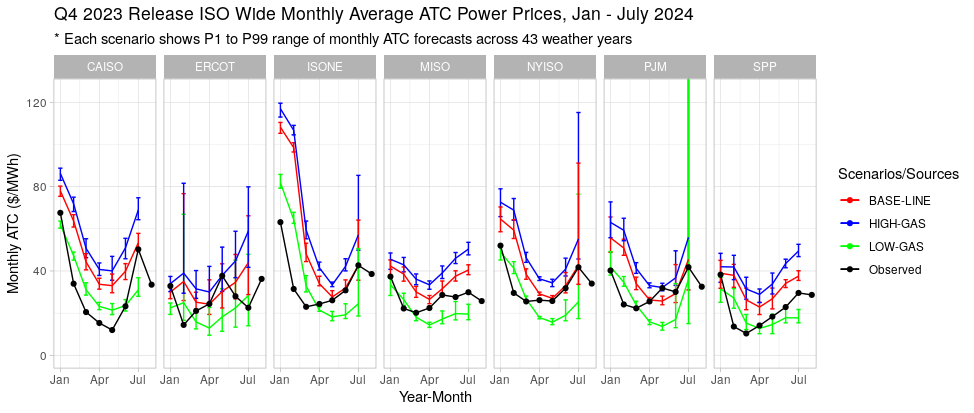
When looking at a view of the gas prices from OTCGH gas forwards back in the fourth quarter of 2023, we can see that the OTCGH gas forwards definitely indicated much higher prices than what were observed later. Again, our fundamentals-based forecasts provide predictions over a variety of gas scenarios besides the Baseline which is based on the OTCGH gas forwards. We provide a High Gas scenario, as shown in the blue curves, and a Low Gas scenario, shown in the green curves, in order to reflect the distribution of outcomes that can result due to different gas price assumptions. It is visible from the graph that the gas prices in the Low Gas scenario that we used back in Q4 2023 were very close to the observed prices in the first half of 2024.

How Are Our Forecasts Doing Figure 2

Our Forecasts on Different Gas Scenarios

With the gas prices assumed in Q4 2023, we can see across different scenarios that the Q4 2023 Low Gas scenario actually predicts power prices that are quite close to what was observed over the first half of 2024. Of course, it won’t always be clear which of our scenarios will provide the best prediction in each release of our Weather-Smart forecasts. But importantly, our forecasts provide a wide range of market fundamentals scenarios and weather conditions that enable our customers to better understand the risks related to gas prices and renewable build-out assumptions, as well as the range of variability across different weather conditions.

Conclusion

This most recent comparison increased our confidence in REsurety’s Weather-Smart forecasts. The fundamentals and weather scenarios we provide reflect the uncertainties in market fundamentals, and assist our customers in evaluating and managing the risks associated with their assessments of renewable projects. We at REsurety will continue to monitor the state of our Weather-Smart forecasts and keep our customers’ best interests and priorities in mind as we move forward.

Return to the blog post main menu.

Paper: Carbon Impact of Transmission Constraints

This paper is authored by REsurety’s Sarah Sofia and Johns Hopkins University’s Yury Dvorkin. Read the abstract and download the full paper below.

Abstract

Carbon accounting frameworks guide policy and decision-making around investments in renewable energy, making them critical to understand in the context of real-world grid operations. In the absence of empirical work assessing the effects of intra-regional congestion on carbon emissions, ongoing policy design assumes that transmission congestion within grid boundaries can be ignored. In this work, we aim to test this assumption by quantifying the frequency and severity of intra-regional congestion and its impacts on carbon emissions and prominent carbon accounting frameworks. This analysis is done in both PJM and ERCOT using nodal locational marginal emissions data. Through several case studies, we find that load that is 100% hourly-matched through load-shifting will often result in significant net operational emissions, and sometimes even increase net emissions relative to annual-matching. This work demonstrates that, in the absence of robust transmission expansion, grid-region boundaries are insufficient to ensure hourly-matching is effective. Impacts of intra-regional transmission congestion are shown to be vital components of effective carbon accounting frameworks, calling into question frequently made assumptions ignoring intra-regional congestion in studies and policy proposals.

Return to the resources main menu.

Blog Post: Achieve Your Financial and Sustainability Goals with Confidence

New accrual and auditing functionality

Authored by Brian Alves, Senior Product Manager, REsurety

Brian Alves, REsurety
Brian Alves
Senior Product Manager

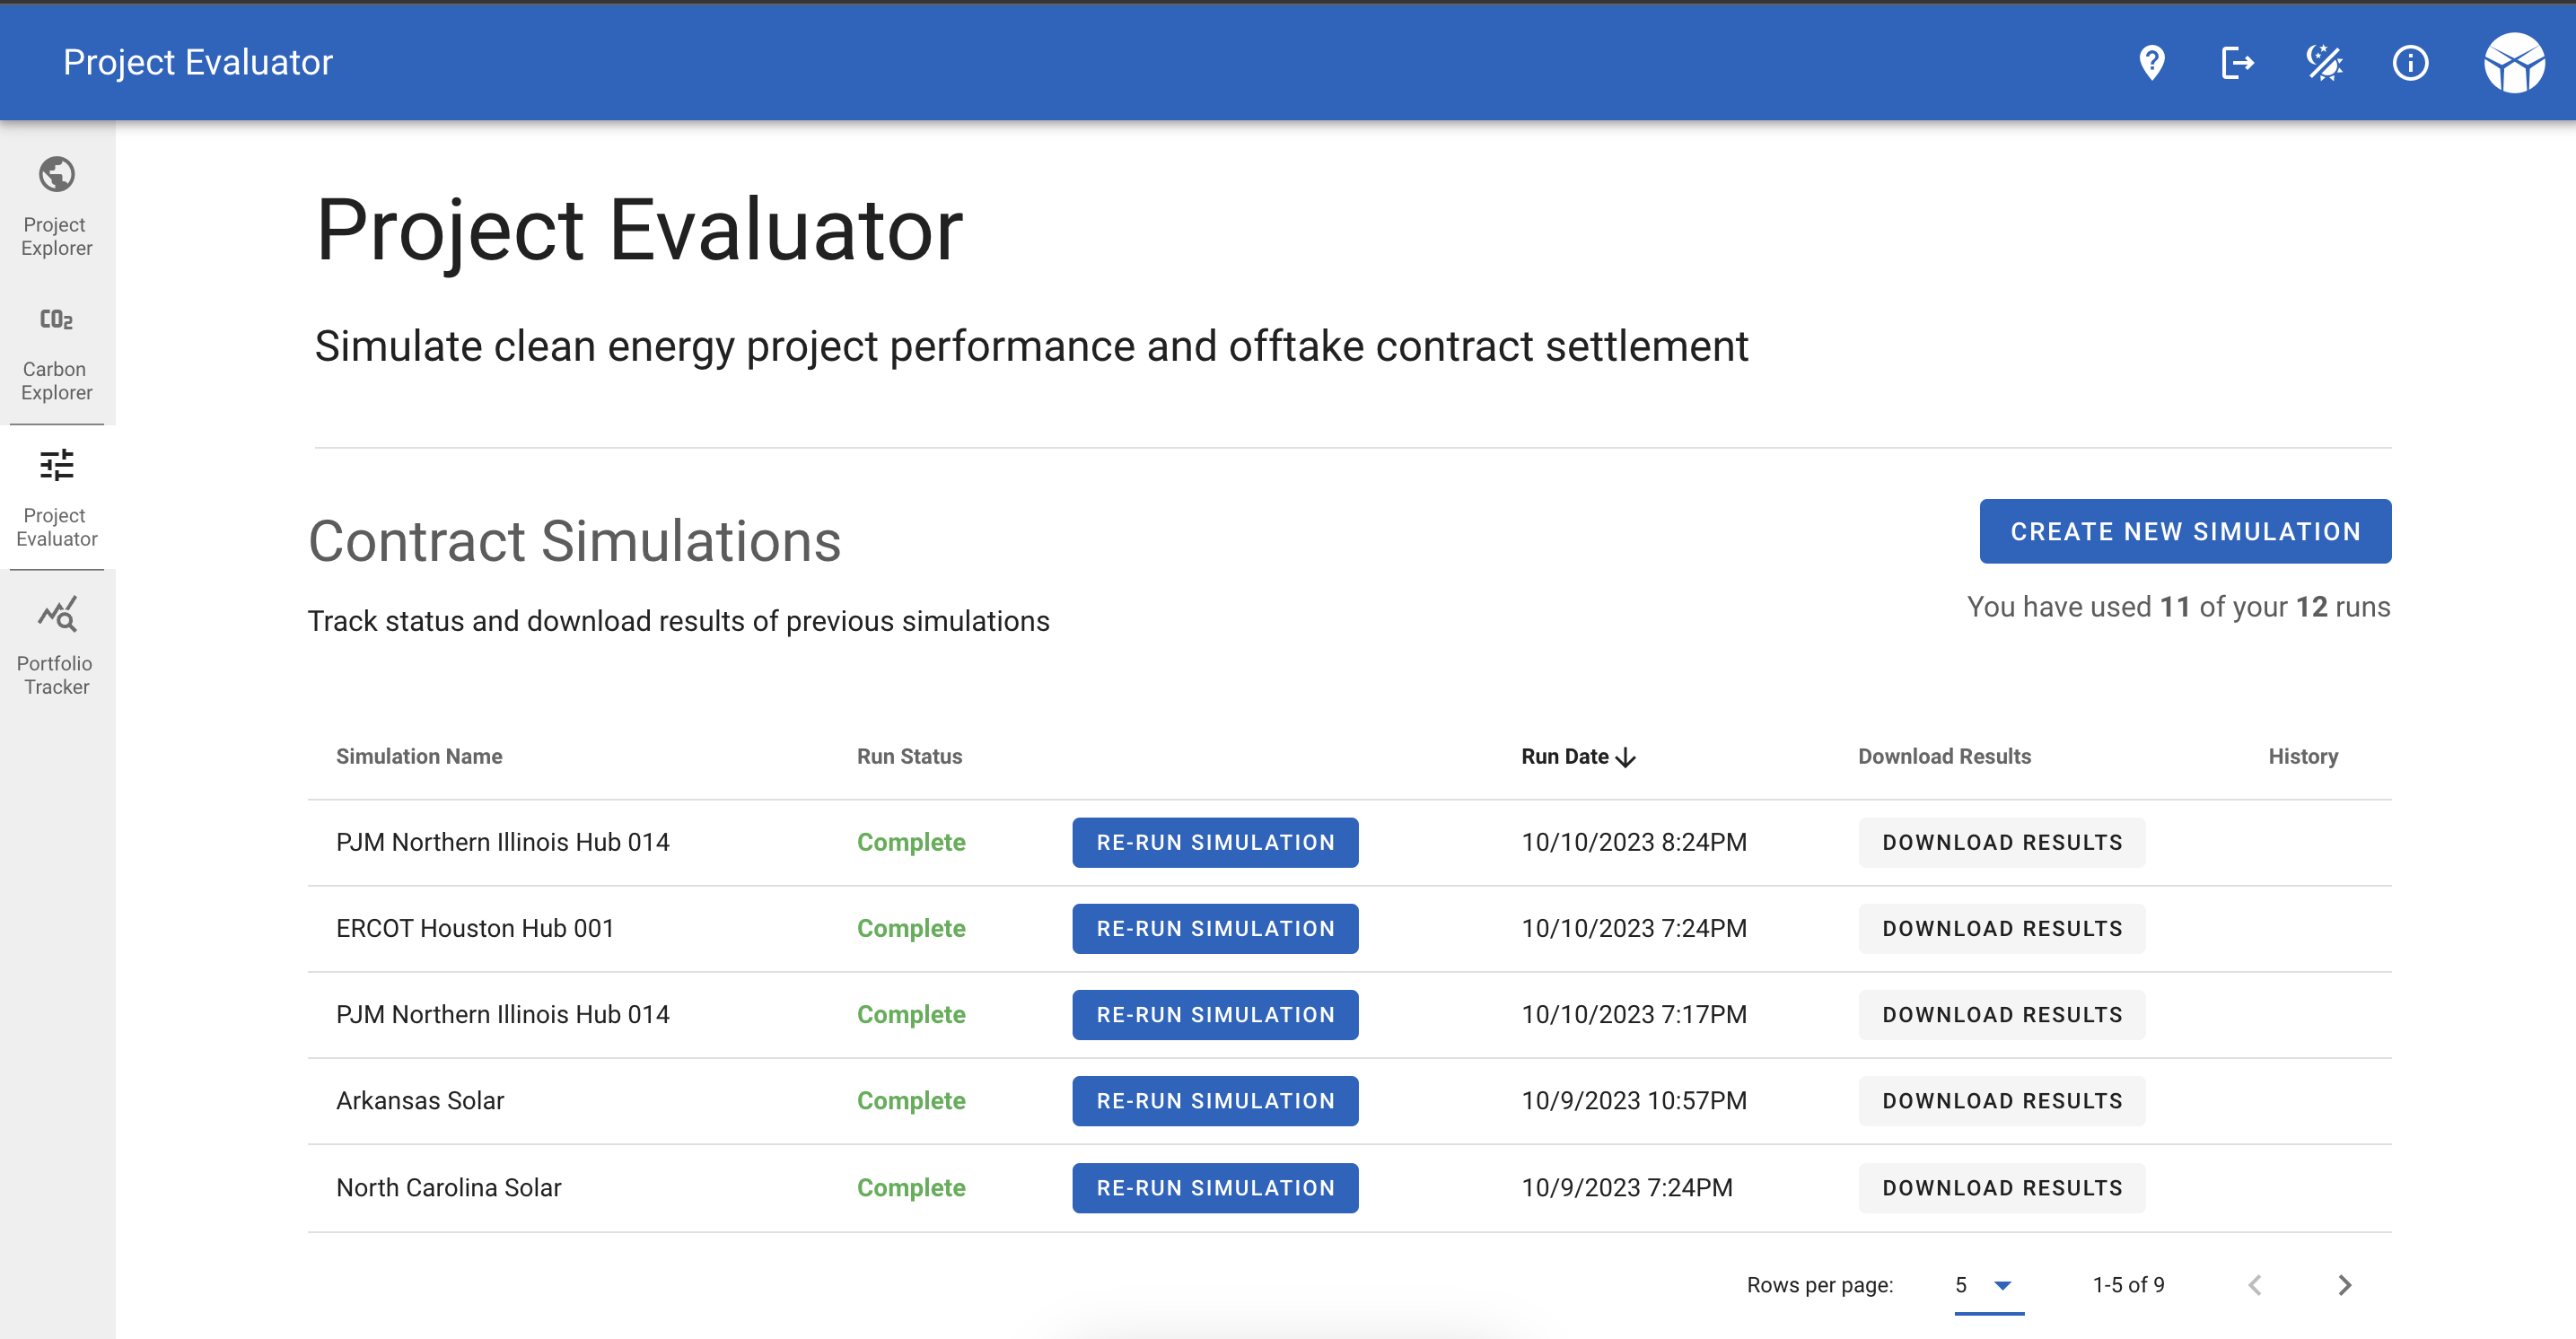
For clean energy buyers, no matter how big their portfolio, every month and quarter brings with it a number of challenges to stay on top of the performance and financial health of their projects. REsurety’s platform provides the means for these buyers to manage their energy portfolios, providing them with tools to accurately model the complexities of their contracts, model performance of their projects when invoiced data is unavailable, and accurately track progress on their carbon emission strategies.

REsurety’s platform can now assist clean energy buyers with their accrual and auditing workflows for any contracts they’re tracking.

Accrue: A portfolio-level view of all contracts that users can see across the entire quarter. To help prepare for financial transactions, we display previously invoiced data where available, and supplement it with REsurety’s generation and revenue modeling capabilities to help users anticipate their settlements before their invoices are received.

Audit: A detailed view of a monthly billing cycle that provides comparisons of invoice data to both third-party and REsurety calculated metrics. The complexity of many contract terms means that mistakes in an invoice can influence final settlement values significantly. Once invoices have been received, our auditing tools can provide a check on these calculations and also provide users the ability to compare invoice prices with that of independent sources.

The process of identifying and establishing the cause of invoice errors, though, can be daunting. Gleaning insights through the complexities of weather and market conditions is difficult which is why REsurety’s professional services team is available to assist. REsurety’s team is a mix of meteorologists, renewable energy and power markets experts, and software engineers who have been working with clean energy leaders for well over a decade. They have the skills and experience to help give you the confidence that your invoices are as accurate as possible. We’re happy to customize a services package tailored to your specific needs.

With this new functionality, we can streamline our customer’s workflows so that they can stay on top of their renewable energy portfolios. By providing the tools to prepare for financial transactions as their contracts accrue, and to audit their invoices as they arrive, we are excited to help our customers hit their financial and sustainability goals with confidence. Get in touch to learn more.

Return to the blog post main menu.

Webinar Recording: Partnering with S&P – Empowering Renewable Energy Markets, The Impact of Emissions Adjusted RECs

Hosted by REsurety and S&P Global Commodity Insights

REsurety logo
S&P Global

Renewable energy certificates (RECs) play a crucial role in steering investments toward renewable energy sources like solar, wind, and hydro. However, despite their importance, the current REC market often lacks transparency regarding the actual emissions impact of these certificates. Buyers aiming to reduce their carbon footprint may not fully understand the real-world impact of their REC purchases, leading to inefficiencies in pricing and market adoption.

This webinar, hosted by S&P Global Commodity Insights and REsurety shed light on the current dynamics of the REC market. We introduced the concept of Emissions Adjusted RECs and discussed how integrating emissions data can revolutionize REC markets, enabling more accurate and impactful trading opportunities.

Key Takeaways

  • Understanding the current REC market and its challenges.
  • Introduction to Emissions Adjusted RECs and their benefits.
  • Insights into the future of renewable energy trading.

If you had previously registered for the webinar, you can access the recording of the webinar below.

Speakers

Charlotte James, S&P Global Commodity Insights
Charlotte James
Associate Director, Renewables
S&P Global Commodity Insights
Adam Reeve, REsurety
Adam Reeve
SVP, Customer Experience
REsurety
Bruno Brunetti, S&P Global Commodity Insights
Bruno Brunetti
Head of Low Carbon Electricity Analytics
S&P Global Commodity Insights

Return to the events page main menu.

Webinar Recording: Exploring Carbon Matching as a Strategy in Energy Emissions Reporting

Hosted by CEBA, featuring speakers from REsurety, GM, Engie, and Baringa

REsurety logo
GM
Baringa

Watch the recording of our recent webinar that explored the benefits and challenges of carbon matching in global decarbonization efforts. The upcoming revision of the Greenhouse Gas Protocol will redefine the future of clean energy procurement, and voluntary markets are crucial in allowing clean energy customers to continue to drive systemic grid decarbonization. Carbon matching is one strategy available to customers in facilitating reporting claims and driving clean energy projects worldwide.

This webinar delved into the basics of carbon matching and its benefits for customers in financing clean energy projects and reducing emissions, as well as the challenges of implementing this approach.

Speakers:

  • Alex Foster, Sustainability Solutions Manager, Engie
  • Robert Threlkeld, Director, Global Energy Strategy, General Motors
  • Sarah Sofia, Senior Research Associate, REsurety
  • Mark Turner, Partner, Baringa

Return to the events page main menu.

VERGE 24

VERGE 2024

REsurety returned to VERGE, the leading climate tech event.

VERGE 24

We were excited to return to the VERGE 2024 event in San Jose, CA, on October 29-31. REsurety’s Lee Taylor, Adam Reeve, Owen Glubiak, Christine Donohue, and Sam Peffer were in attendance.

Adam Reeve
Adam Reeve
SVP, Customer Experience
Owen Glubiak
Owen Glubiak
VP, Business Development
Christine Donohue
Sales Manager
Sam Peffer
Account Executive

Lee Taylor was also part of a panel, Putting Impacts First: Building a Comprehensive Clean Energy Procurement Strategy, on Wednesday, October 30. Learn more about the panel below.

Title: Putting Impacts First: Building a Comprehensive Clean Energy Procurement Strategy

Description:
Businesses face pressure from investors, competitors, and employees to excel in sustainability when procuring energy. It is easy to get caught up in the rush to meet targets, but this is more than just a numbers game. We are all part of a more significant movement to combat climate change.

Join our panel of thought leaders to delve into research, understand the impact of emissions and particulate matter, and discover best practices to humanize your approach to everything from environmental attribute certificates (EACs) to emissions mitigation across your business to further solidify your environmental strategy.

Location: LL21E, Convention Center

Speakers:
Daniel Howard, CEO, Quantum Energy
Faraz Ahmad, Operations Manager, Amazon
Katie Robinson, Sustainability Strategist, Akamai Technologies
Lee Taylor, CEO, REsurety
Shalini Majumdar, Manager, Sustainability Strategy & Implementation, ENGIE Impact
Tom Harper, Partner – US Energy Market Advisory, Baringa Partners

About the event

VERGE 24 is a three day day climate tech conference that is the center of gravity for professionals catalyzing transformative, profitable change through decarbonizing their operations and supply chains. It is where practitioners doing the hard, ongoing work of integrating climate solutions share their successes, setbacks and insights to smooth the path forward for all.

Join more than 6,000 leaders on October 29-31 in San Jose, CA to discover what it takes to deploy climate tech at scale. Tap into the knowledge, connections and inspiration needed to de-risk your strategies and supercharge your impact alongside other visionaries, experts and innovators leading the way to a regenerative and just future.

Return to the event page main menu.

S&P Global Commodity Insights Financing US Power Conference

REsurety was excited to return to the event

Financing US Power Conference 2024

We were excited to attend the S&P Global Commodity Insights Financing US Power Conference again on October 23-25, 2024, in Houston, TX. REsurety’s Emma Marjollet and Steven Nixon were in attendance.

Emma Marjollet
Emma Marjollet
Account Executive
Steven Nixon
Account Executive

About the event

The 2024 Financing US Power Conference is set to be an unparalleled gathering of prominent figures and specialists from the power finance and generation sectors. This year, our speakers collectively manage over $8.5 trillion in assets, underscoring the caliber and influence of the insights and discussions you will experience. Join us for engaging conversations, bespoke networking sessions, and invaluable perspectives you won’t find anywhere else.

Return to the event page main menu.

Paper: Validating Locational Marginal Emissions Models with Wind Generation

This paper, authored by Nat Steinsultz, Pierre Christian, Joel Cofield, Gavin McCormick, and Sarah Sofia was published by IOP Science in Environmental Research: Energy, Volume 1. You can find the full paper here, or download a PDF version by clicking the button below.

Paper: Validating Locational Marginal Emissions Models with Wind Generation

Abstract

Increasingly large amounts of electric supply and load are being deliberately operated or sited on the basis of marginal emissions factor (MEF) models. Validating and calibrating such models is therefore of growing policy importance. This paper uses a natural experiment involving variation in relative changes in wind generation potential at wind farms in the ERCOT power grid to create a benchmark MEF and examine the relative accuracy of several common classes of short term MEF models. This work focuses on MEFs at the level of a few individual generating nodes, a much smaller geographic scale than the Balancing Authority (BA) or load zone. Additionally, the use of wind generation potential as a regressor allows us to factor in wind curtailment, in contrast to previous work. We evaluate multiple prevalent existing MEF models and find that both dispatch and statistical MEF models have a high degree of agreement with the benchmark MEF, while heat rate and average emissions do not. We also find that the emissions reduction benefits of optimizing electricity with MEFs using a geographically granular model instead of a BA-wide model are 1.4, 1.3 and 1.5 times larger for dispatch, statistical and heat rate models, respectively.

Return to the resources main menu.

Q2 2024 State of the Renewables Market Report

A view of Q2 2024 U.S. renewable energy performance

Q2 2024 State of the Renewables Market Cover

REsurety creates the State of the Renewables Market report every quarter to provide readers with data-driven insight into the value and emerging trends of renewable generation in U.S. power markets. Please fill out the form to access the full report, the Editor’s Note is below.

Editor’s Note:

Maha Mapara, REsurety
Maha Mapara
Analyst
Senior Analyst,
Analytics Services
REsurety's Devon Lukas
Devon Lukas
Lead Analyst
Associate,
Analytics Services
REsurety's Carl Ostridge
Carl Ostridge
Editor
SVP,
Analytics Services

Deliverability: Can Clean Energy Reach Consumers?

Clean energy generators are the fastest growing sources of new energy on grids across the country. But if the impact of those new projects is going to be maximized, and utilized meaningfully in hourly matching carbon offset techniques, the country also needs to invest large sums in improving transmission infrastructure to get the clean energy to load centers. There have been a couple of recent announcements aiming to speed up the development of much-needed transmission (e.g. FERC Order 1920 and Department of Energy TSED funding), but how much of a problem is transmission currently?

To answer this question, we’ll use the concept of “deliverability” – in other words, how much clean energy can reach consumers in a given location. The concept of deliverability is already built into the market prices that system operators publish. There are three components to Locational Marginal Prices (LMPs); energy, congestion, and line losses. Line losses tend to contribute relatively little to the overall prices, and so we can use the difference in LMPs between two locations to estimate the deliverability of the energy. When the LMP at a generator diverges materially from the LMP at the load center, this is a sign that the location is experiencing congestion – either high prices that encourage generation, or low (even negative) prices resulting in renewable generator curtailment.

For this analysis, we’ve defined power as “deliverable” if the LMP at the generator is within 10% of the LMP at the load center. Renewable generation output during periods with greater than 10% LMP divergence is likely subject to congestion, and is therefore considered undeliverable. This is a somewhat simple metric, but it aims to boil down a complex issue into something digestible and relevant; after all, deliverability is a key component in the developing hourly matching frameworks.

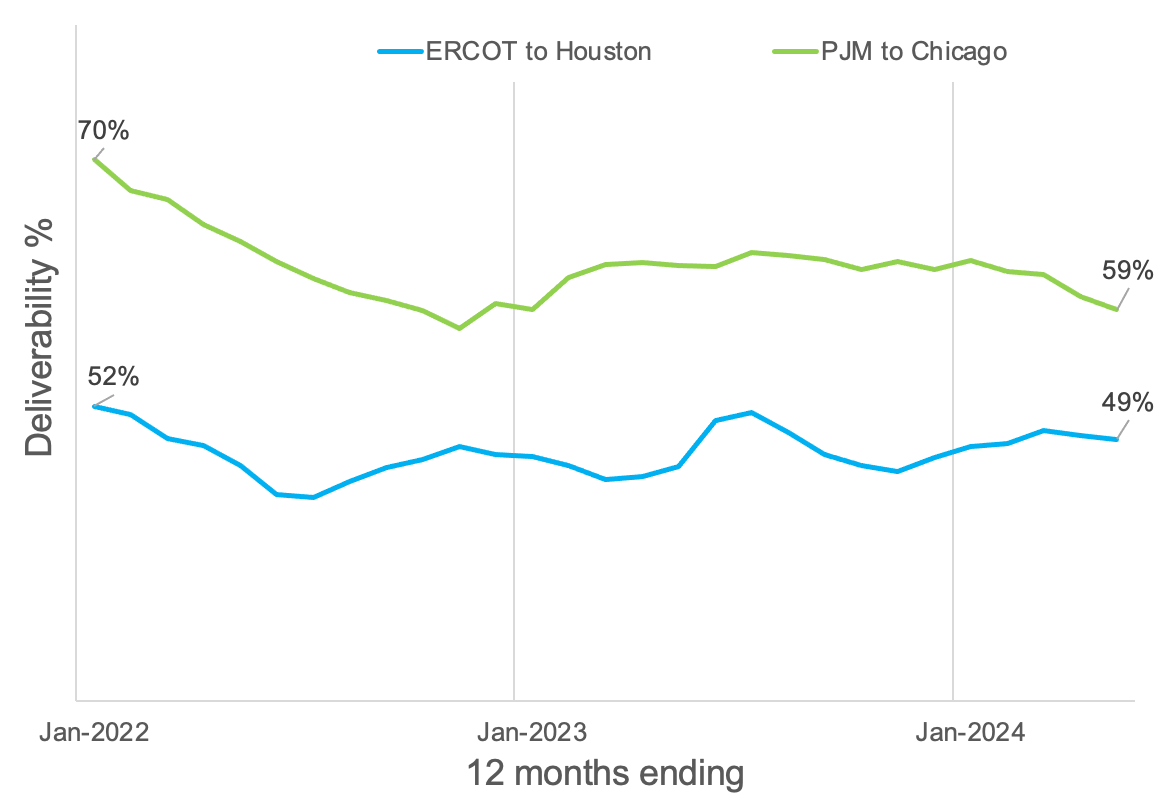
In Figure 1, the 12-month trailing average of deliverability is shown for clean energy generators in ERCOT and PJM and load centers in Houston and Chicago, respectively. Historically, only between half and two-thirds of clean power is “deliverable” to these major load centers. This highlights that transmission congestion has been, and still is, a meaningful issue. It’s also notable that despite higher penetration levels of wind and solar in ERCOT, the deliverability of clean energy to Chicago has dropped more rapidly since the start of 2021.

Figure 1: Trailing 12-month average clean energy deliverability to Houston and Chicago.

When we look a little deeper at the ERCOT deliverability, separating the results for wind and solar projects, the story of the flatter deliverability trend becomes clearer. The deliverability of wind in ERCOT has been trending downwards over the past few years, while solar has trended upwards. There are two factors in favor of solar’s better deliverability: timing and location. Solar’s on-peak generation coincides with higher load, leading to fewer congestion issues. Furthermore, the operational solar fleet is more geographically dispersed compared to the wind fleet, meaning fewer solar projects are subject to major transmission constraints (such as in the Texas Panhandle and Gulf Coast).

Table 1: Deliverability of ERCOT wind and solar energy to Houston.

Of course, these trends will evolve over time as more clean energy is added to the grid, thermal generators are decommissioned, energy storage capacity expands, gross and net load profiles evolve, and transmission either stays constant or gets upgraded. This metric is just the beginning of our efforts to analyze this complex issue. A REsurety whitepaper on deliverability is in the works, covering more regions and diving deeper into the underlying causes and resulting carbon impacts.

Q2 2024 Report Download

"*" indicates required fields

Name*
This field is for validation purposes and should be left unchanged.

Return to the blog post main menu.

Blog Post: Hot Grid Summer 2024

Jessica Tomaszewski

Insights Gained from the 2023 ERCOT Heat Event

Authored by Dr. Jessica Tomaszewski, Senior Research Scientist, REsurety

Dr. Jessica Tomaszewski
Senior Research Scientist

Summer is well underway across the United States, ushering in another year of heat and drought. The National Weather Service has issued over 4,800 excessive heat warnings nationwide this summer, invoking memories of the anomalous heat many parts of the country experienced just a year ago. The state of Texas notably experienced its second-warmest summer on record in 2023, with an average temperature over 85°F, four degrees warmer than the 20th century average. Energy demand and power prices soared alongside the temperatures – all variables that can be difficult to predict and prepare for without the right tools and data.

We at REsurety are reaffirming our commitment to data-driven practices and are reflecting on the insights gained from the summer of 2023 in order to best understand and predict heat waves’ impacts on the electrical grid in 2024 and beyond.

What caused the heat wave?

The historic heat in 2023 was brought to Texas via the effects of a heat dome, a meteorological phenomenon characterized by the presence of extreme heat over a region that lingers for an extended period of time.

To best understand heat domes, it helps to have a bit of knowledge about atmospheric dynamics. Generally, the atmosphere is a three-dimensional fluid, and the upper layer affects the surface conditions (and vice versa). An important feature of the upper level is the jet stream, a fast current of air four to eight miles above the ground that directly affects (and is affected by) surface weather patterns while acting as a sharp boundary between warm and cold air masses. When the jet stream takes on a more wavy shape, troughs and ridges form, which drive weather at the surface below. Ridges form when the jet stream arcs northward, and they are associated with warm air, high pressure aloft, and dry, sunny weather at the surface.

During a heat dome event, a stronger-than-usual ridge in the jet stream like the one present in the summer of 2023 causes a hot air mass to form (illustrated below). A key feature of a heat dome is that it is self-sustaining, meaning it is fueled by its own impacts. As the hot air in a heat dome rises and expands, it creates a tall column of high pressure that pushes warm air down toward the ground (right), which suppresses clouds and precipitation. Air sinking against the ground leads to compressional warming, as dictated by the laws of thermodynamics. The combination of ample sunshine and compressional warming warms the surface even more. Warm surface conditions quickly dry out the soil moisture, another contributor to efficient heating. The now-hotter air mass continues to expand vertically in the atmosphere and deepens the ridge in the jet stream, and the cycle persists, sometimes for weeks at a time.

Insights Gained from the 2023 ERCOT Heat Event - Heat Dome

Source: REsurety

How do heat waves impact demand and renewable energy production?

Such extreme heat can have severe or even deadly human impacts, so air conditioning is widely used to keep people safe and comfortable. As more homes utilize air conditioning, powering those units requires significant energy from the electrical grid, which in the state of Texas is largely operated by the Electric Reliability Council of Texas (ERCOT), to meet that demand.

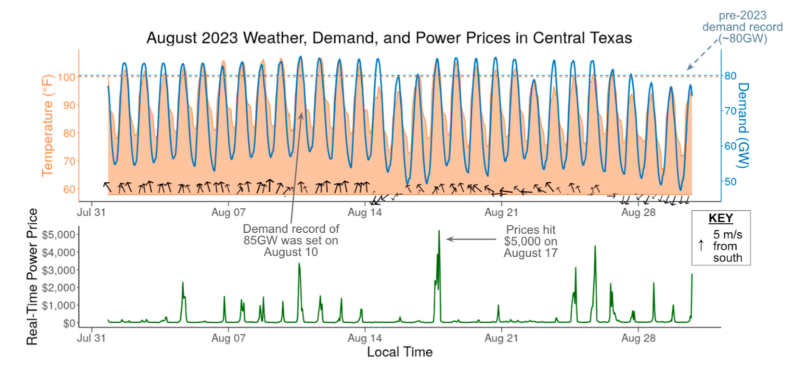
The relationship between hot temperatures and energy demand can be seen in the below hourly time series at a point in central Texas over the month of August 2023. Temperature is shaded in orange, with a horizontal line at 100 ºF to draw attention to the large quantity of consecutive 100+ ºF days that occurred. The blue line represents the total ERCOT grid demand, with the pre-2023 demand record of 80 GW dashed horizontally to emphasize how many times that value was surpassed in 2023. A new ERCOT demand record of 85 GW was set on August 10.

The heat and high demand led to high power prices as well, which is seen in the green plot of real-time prices at a nearby hub. Prices surpassed $1,000/MWh over a dozen times, and hit the $5,000 price maximum on August 17. Interestingly, the highest price day does not coincide with the day with the highest temperatures and demand, which occurred on August 10.

Source: REsurety

The reason for the difference in power prices between two similarly hot days largely lies in the availability (or lack thereof) of low-cost sources of electricity generation like wind and solar. The arrows in the above time series represent the relative magnitude and direction of the wind speeds experienced in ERCOT. On August 17, weak winds caused wind generation to dip below the ERCOT “low wind” scenario, which, when coupled with temperatures above 100 ºF, forced ERCOT to utilize more expensive generation sources to meet high demand, leading to the extreme prices seen on that day.

Generally speaking, heat domes can have variable impacts on renewable generation depending on the energy source and event-specific weather conditions occurring at the surface. According to Vaisala’s Climate Reference Tool, the 2023 heat dome led to clear, dry conditions that were up to 20% sunnier than usual over much of Texas, allowing above-average production of solar energy across the month. Conversely, the heat dome did not have a clear impact on average wind speeds: Wind speeds in some areas of Texas were above average in August 2023 when compared to a typical August, while others were below average. Data does not show a correlation between temperature and wind generation in ERCOT. Some of the hottest days did have low wind generation (like August 17) but others didn’t. Wind generation isn’t always low on hot days, though from a grid reliability and price management perspective, it’s important to plan for the scenario where it might be.

How should extreme events be accounted for in power price forecasts?

Atypical weather conditions like heat waves can both increase demand and limit the generation that’s available to meet that demand, thereby affecting power prices. The status quo approach in power price forecasting is to assume weather conditions in the future will resemble a single, “normal” weather year. The result of the weather-normal year approach is that price forecasts lack awareness of the extreme price events produced by extreme weather events.

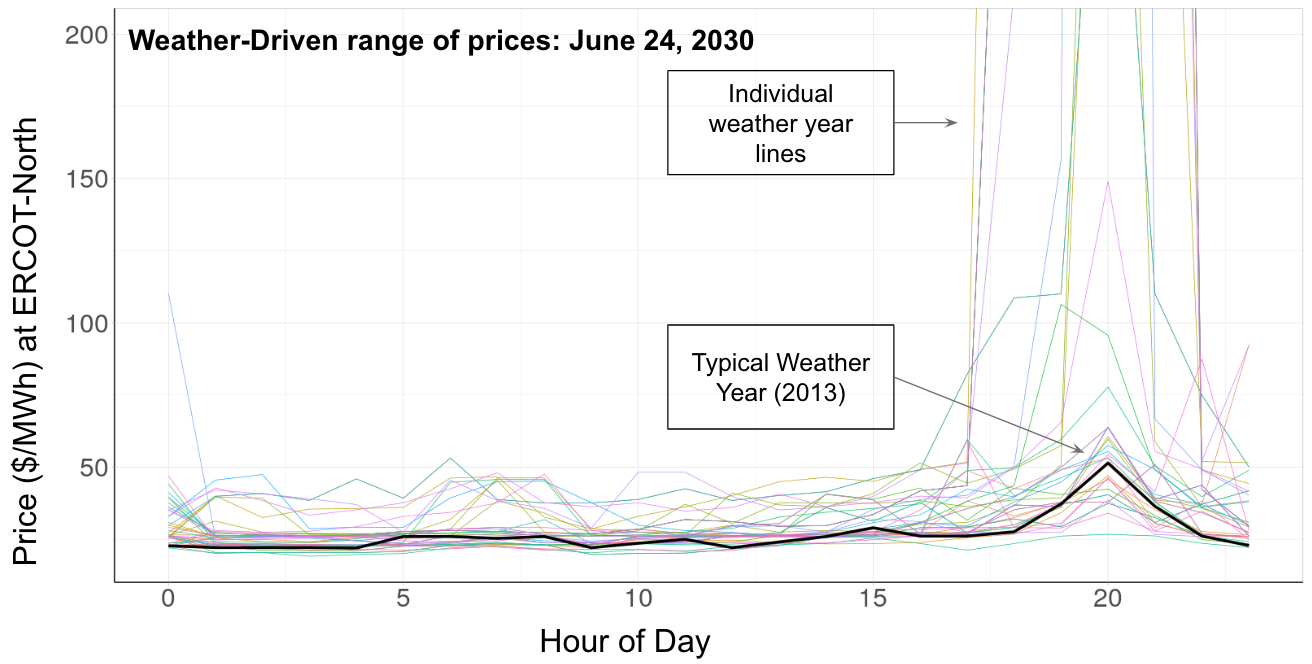
However, REsurety takes a different, Weather-Smart approach: Instead of using a typical weather year to create a power price forecast, we incorporate extreme events into our forecasts by simulating demand and generation under a variety of weather conditions. The value of this approach is illustrated in the plot below, wherein the hourly forecast power prices are plotted for a June day in 2030. The black line denotes the price of power that we forecast if we assume weather conditions resemble a typical weather year of 2013, and all of the individual colored lines indicate the power prices that we forecast based on different weather conditions. It is clear that the resulting forecasted power prices for a given day are largely impacted by the weather conditions used as input for the model and that some weather conditions can lead to extreme power prices.*

Outlook

Heat domes are not a Texas-specific phenomena. In June 2021, an anomalous ridge in the jet stream formed in a particularly unusual location over the Pacific Northwest, causing record high temperatures, severe drought, and wildfires. This past June, a heat dome with triple-digit heat indices stagnated over the Northeast and Mid-Atlantic regions for over a week, prompting the grid operators at PJM to issue a Hot Weather Alert to mitigate expected increases in electricity demand. Much of the continental United States needs to be prepared for the potential of extreme heat.

Average Number of Heat Waves Per Year

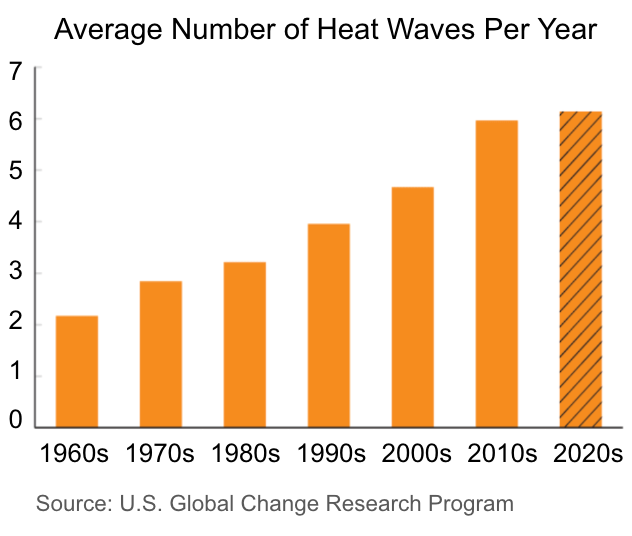
Furthermore, the average quantity, intensity, and length of heat waves have steadily increased in the United States over the last several decades. According to the Intergovernmental Panel on Climate Change, extreme heat waves are predicted to be almost twice as likely as they are today and nine times more likely than they were in the pre-industrial period [1]. As extreme heat waves become more common, understanding the intersection between weather, power markets, and energy economics will only become more critical, and REsurety will continue to lead efforts to advance this understanding.

REsurety is a mission-driven organization dedicated to accelerating the world’s transition to a zero-carbon future. We provide software and services to support both the financial and sustainability goals of clean energy buyers, sellers, and investors. Our software offers data-driven insights at various stages of the project lifecycle from initial exploration to portfolio management. Our services leverage our domain expertise and deliver solutions tailored to the unique needs of our customers. Reach out to learn more: [email protected].

*While REsurety’s Weather-Smart approach offers advanced forecasting capabilities, users should be aware that all projections are subject to uncertainties and potential inaccuracies.

References

[1] IPCC Summary for Policymakers from Climate Change 2021: The Physical Science Basis. Contribution of Working Group I to the Sixth Assessment Report of the Intergovernmental Panel on Climate Change.

Return to the blog post main menu.

Blog Post: ERCOT Price Corrections

The settlement impact explained.

Authored by Marion Cundari, Senior Associate, Analytics, REsurety

Marion Cundari
Senior Associate, Analytics

Did you know that the Electric Reliability Council of Texas (ERCOT) corrects market prices after publication? Often price corrections occur before the price is considered final and published. But what about when price corrections occur after market prices are considered final?

The latter scenario, while infrequent, does happen. In the past nine months there have been two scenarios where prices were retroactively updated. When ERCOT deems a published price to need a correction, the process by which the price is updated is lengthy as it requires the ERCOT board to approve the proposed price change. Often more than a month passes between the price interval to be corrected and the publication of the corrected price.

Given the lag in publication of a corrected price, there is a large potential to impact contract settlement accuracy if price corrections are not consistently monitored and incorporated into settlement.

In the past nine months there were two instances of retroactive price corrections issued by ERCOT. In October 2023, there was a brief price correction that was very large in magnitude (over $2,600/MWh). Additionally, on April 23, 2024, ERCOT made corrections to January and February 2024 prices, changing retroactively yet again, this time for more periods but by smaller amounts. Both examples have the potential to significantly impact contract settlement and a compounding impact on a portfolio of contracts.

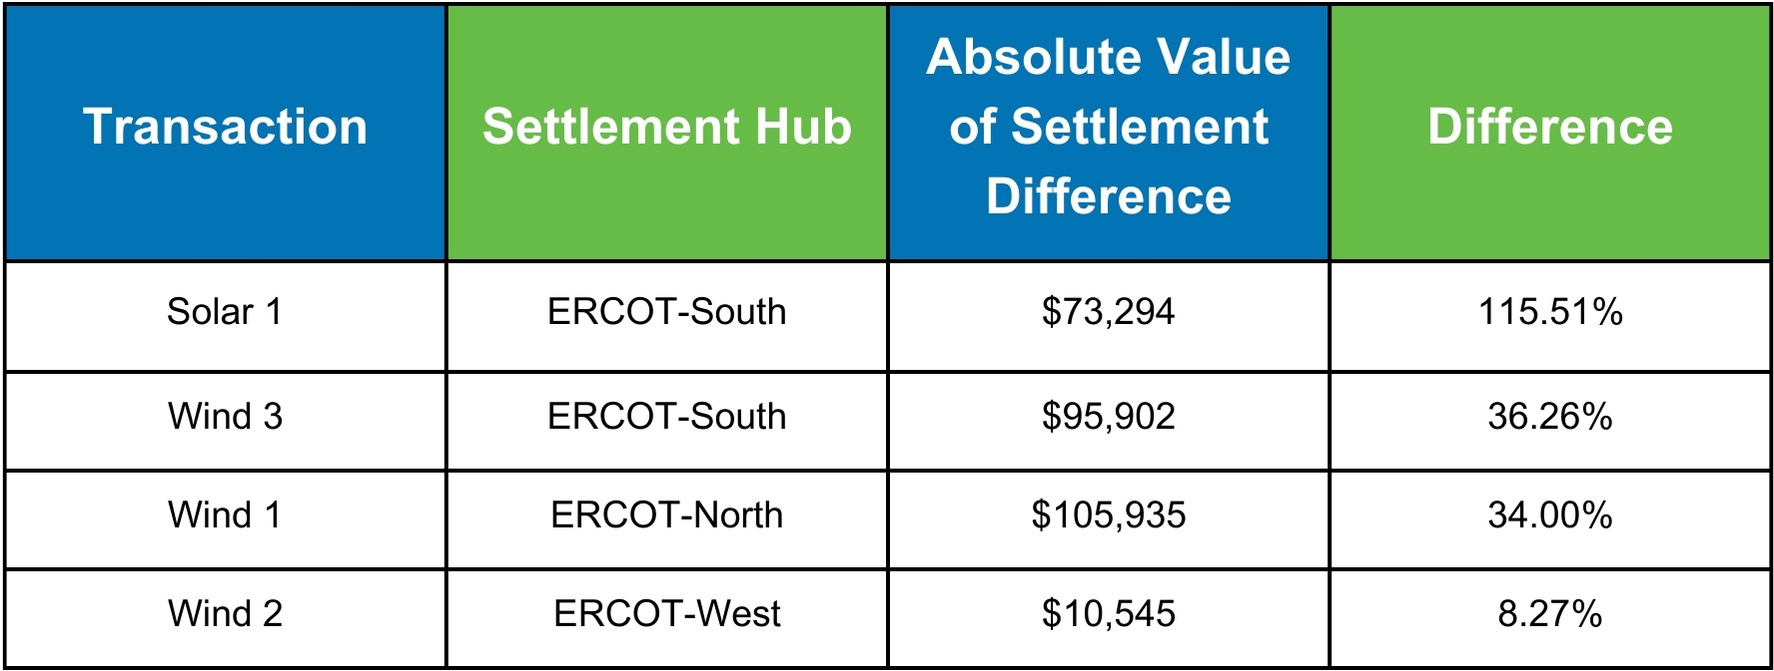
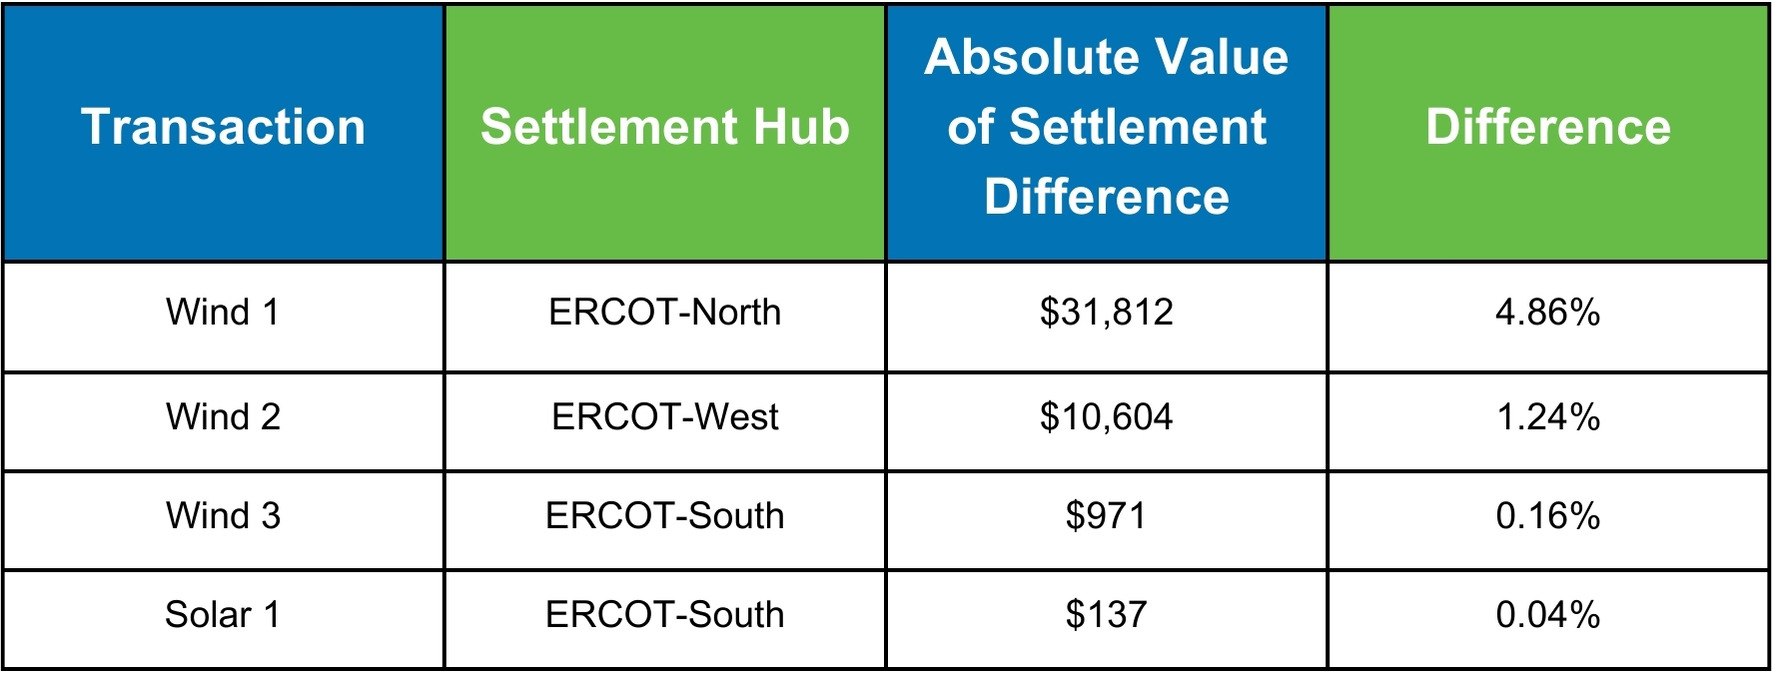
The original published price for one hour in mid-October was $2,667.64. It was later corrected, over a month later, to $23.70. This is a large change in price and its impact varied based on project generation over the specific interval. In the below table, example Wind Transaction 1 was generating at peak capacity over the correction interval while example Wind Transaction 2 was not.

October 2023 Price Correction Example Settlement Impact

In January and February, price adjustments spanned multiple hours on January 15-19 and February 28, 2024. The severity of the price updates was far less drastic than the above discussed October price correction. On average, across the roughly 200 impacted 5-min intervals and ERCOT North, West, and South hubs, prices changed by -$2.19. While the price change was smaller in magnitude, actual cash settlement differences were significant at some transactions. It is worth noting that the impacted intervals were primarily after sunlight hours, therefore negligibly impacting solar transactions.

January and February 2024 Price Correction Example Impact

At REsurety, our calculation services team performs monthly price verification to ensure our settlement calculations always use the correct prices as published by each ISO. This verification process includes monitoring Independent System Operators (ISO) market notices. Price corrections in ERCOT will always be flagged within a market notice from ERCOT before the price eventually gets corrected. REsurety’s verification also includes notification to transaction parties of expected price corrections for previous periods before they show up in settlement reports.

Learn how our calculation services team can assist you, contact us.

Return to the blog post main menu.

American Clean Power Resource & Technology Conference

REsurety’s Sarah Sofia and Aaron Perry spoke on two different panels at the event

ACP Resource & Technology 2024
Sarah Sofia
Sarah Sofia
Senior Research Associate
Aaron Perry
Aaron Perry
Director,
Analytics Services

REsurety attended the ACP Resource & Technology Conference from September 30 – October 2, 2024 in Phoenix, Arizona. REsurety’s Aaron Perry, Director of Analytics Services, joined the panel, The Green Hydrogen Saga on Tuesday, October 1. Sarah Sofia, Senior Research Associate at REsurety, joined the panel, Advancements in Transmission Technology – Focus on GETs on Wednesday, October 2. Learn more about the sessions below.

Title: The Green Hydrogen Saga

Location: Regency C

Speakers:
Session Chair: Marcel Mibus, Apex Clean Energy
Presenter: Dan W. Bernadett, P.E., ArcVera Renewables
Presenter: Kaitlin Brunik, National Renewable Energy Lab
Presenter: Shadi Darvish, DNV
Presenter: Aaron T. Perry, REsurety

Title: Advancements in Transmission Technology – Focus on GETs

Location: Regency C

Speakers:
Session Chair: Sarah Toth, Rocky Mountain Institute
Presenter: Ted I. Block-Rubin, Smart Wires Inc.
Presenter: Sarah Sofia, REsurety
Presenter: Allison Wilkes, LineVision

Register to attend the conference here.

About the event

Join your peers as we build the future of the clean energy industry. Share and discover cutting-edge technological innovations and advancements in the area of renewable energy assessment and performance and reliability improvements at ACP’s Resource & Technology Conference.

Return to the event page main menu.

Webinar Recording: How to Create an Accurate and Useful Capture Rate

REsurety logo
Marathon Capital

Marathon Capital’s Joan Hutchinson shared her expertise

As the world shifts from a fossil-fuel-driven, high carbon environment to the decarbonized future of tomorrow, Marathon Capital is dedicated to supporting businesses, governments, and non-governmental organizations navigate the risks and challenges associated with their environmental impact.

In this webinar, REsurety’s Blair Allen spoke with Marathon’s Joan Hutchinson about how she helps customers navigate the challenges in valuing wind and solar energy. She drew from experience and explained how she’s helped a variety of customers understand capture prices, capture rates, and the different ways to calculate them. Questions they answered included:

  • Where different generation profiles may appear in decision making and why.
  • How to interpret the differences in value when using different generation profiles, and the impacts of those differences.
  • When to turn to historical data to support forecasted value analysis.

The event was interactive and there was a Q & A session after the presentation. Watch the full recording of the webinar below.

About the speakers

Blair Allen, Director, Customer Success, REsurety

Blair Allen, REsurety

Blair Allen is a clean energy executive dedicated to accelerating the world’s transition to a zero-carbon future. Throughout his 5 year tenure with REsurety, Blair has held various positions across the organization including product management and his current role leading the customer success team.

In his current position, Blair plays a critical role in ensuring that the company’s customers – clean energy buyers, sellers, and investors – are all able to optimize the REsurety platform to meet their financial and sustainability goals. Customers rely on Blair and his team for industry knowledge, technical expertise, and willingness to suggest innovative solutions to overcome customers’ unique challenges. 

Prior to joining the REsurety team, Blair worked as a Senior Market Analyst offering price and congestion forecasts to customers with physical or financial risk in MISO.

Blair holds a Bachelor’s degree in Philosophy from Bucknell University, with a minor in Economics

Joan Hutchinson, Managing Director & Co-Head, Offtake Advisory, Marathon Capital

Joan Hutchinson, Managing Director & Co-Head of Offtake Advisory, is based in Marathon Capital’s San Francisco office. Joan advises corporate clients to set and meet sustainability goals, including energy offtake agreements, carbon reduction, and energy transition strategies. She advises developers on physical and financial offtake agreements to support financing and enhance project value. Joan has advised Nestlé, TC Energy, and Tokyo Gas on recent sustainability initiatives.

Joan has over 25 years of experience in North American energy markets and renewable energy project development. Before joining Marathon Capital, Joan was Vice President of Origination & Business Development at Ørsted A/S, where she led the origination of wind, solar, and storage projects resulting in over 1600 MW of transactions in three years. Many of the transactions Joan completed were power purchase agreements with first-time corporate buyers.

Prior to Ørsted, Joan was SVP Origination & Marketing for Ridgeline Energy, responsible for negotiating contracts for the sale of power and renewable energy credits from renewable projects, leading solar development, and the acquisition of wind and solar projects. Joan was Director of Origination at Citigroup Energy and held various origination and trading positions with Powerex, Inc.

Joan received her Bachelor of Electrical Engineering from the University of Victoria in Victoria, B.C., and holds a Series 79 license.

Return to the events page main menu.

Blog Post: REsurety Adds Support for Budgeting to Portfolio Tracker

Tara Bartley

Customers can now easily find forecasted metrics for their PPA and REC budgeting workflows

Authored by Tara Bartley, VP, Marketing, REsurety

Tara Bartley
Tara Bartley
VP, Marketing

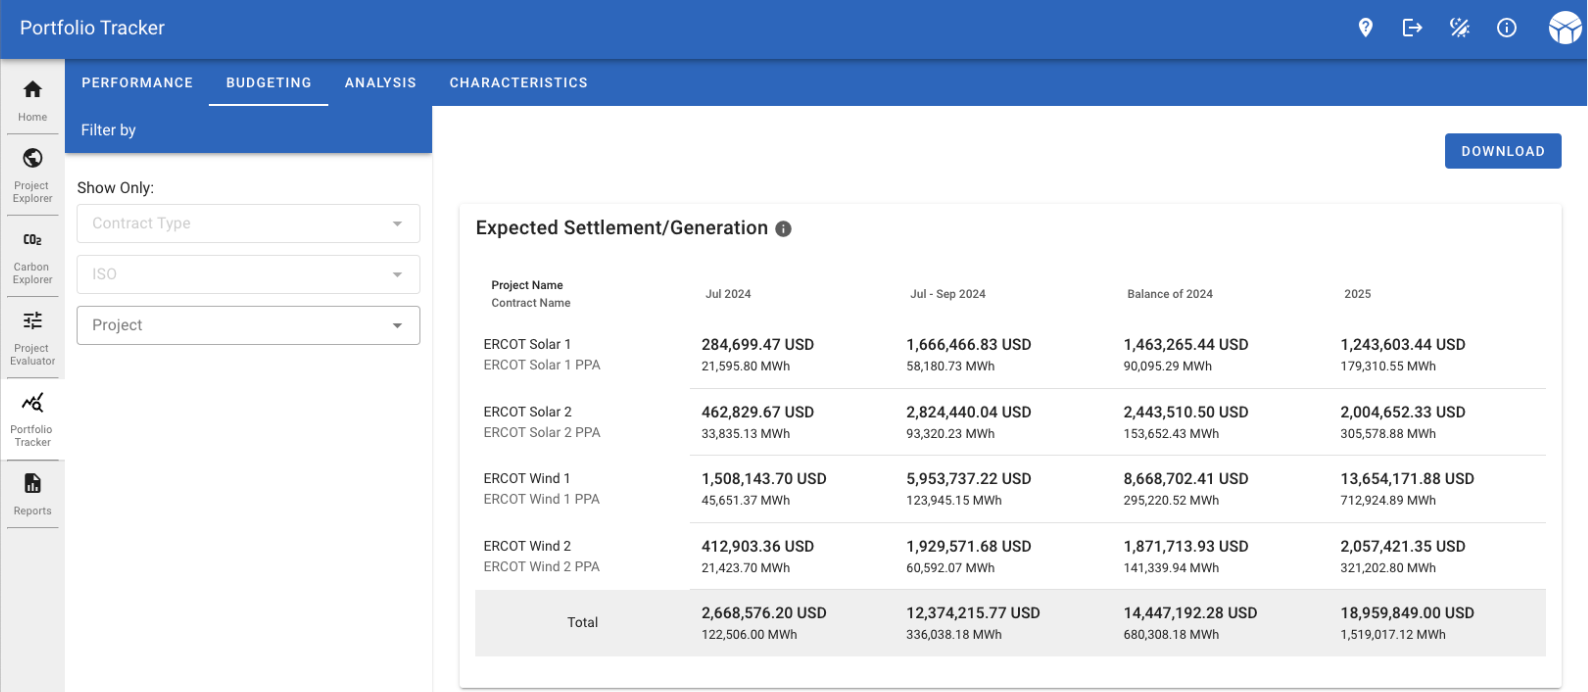
As part of the REsurety software platform, Portfolio Tracker was designed specifically for clean energy buyers and investors to forecast, audit, and explain the financial and environmental outcomes of clean energy projects and contracts. It was developed to analyze how wind and solar contracts are performing and what risks they hold; predict how settlement might occur going forward; and to track project and contract-specific carbon emissions and financial performance.

With today’s release of a new budgeting dashboard, customers can easily access forecasted settlement metrics for their contracts, including forecasts for the next month, quarter, the remainder of the current year, and for the following year. Long-term financial settlement forecasts, and forecasts for generation (and associated REC production), are available in the tool as well. Importantly, all of REsurety’s forecasts are Weather-Smart – meaning they take into account the wide range of future weather conditions that can have an immense impact on the price of power. Moreover, Portfolio Tracker automatically accounts for contract terms such as price floors, for example, applying them at the hourly level and aggregating settlement calculations to produce forecasts that are specific to individual renewable energy projects and contracts.*

Portfolio Tracker Budgeting Tab

The budgeting dashboard was designed with our customers’ renewable energy portfolio budgeting workflows foremost in mind and we are excited to help our customers hit their financial and sustainability goals with confidence. Get in touch to learn more about Portfolio Tracker.

*While Portfolio Tracker offers advanced forecasting and auditing capabilities, users should be aware that all projections are subject to uncertainties and potential inaccuracies.

Return to the blog post main menu.

Smart Energy Decisions Renewable Energy Forum

Smart Energy Decisions Renewable Energy Forum

REsurety was excited to attend the event in Aventura, FL.

Smart Energy Decisions Renewable Energy Forum 2024
Christine Donohue, Sales Manager

REsurety’s Christine Donohue attended the 2024 Smart Energy Decisions Renewable Energy Forum on June 12-14, 2024, in Aventura, Florida. To learn more or get in touch with REsurety, click the button below:

About the forum

The Renewable Energy Forum delivers peer learning, networking, and consultative meetings to energy and sustainability professionals pursuing information and solutions to advance their organization’s renewable energy goals.

Held once a year and produced by Smart Energy Decisions – the first digital resource dedicated to addressing the information needs of large power customers – the Renewable Energy Forum is a valuable step in your emissions reduction journey.

Access the agenda for the event here.

Return to the event page main menu.

Policy Brief: Assessing the Impact of Voluntary Actions on the Grid

A Consensus Paper from ZEROgrid’s Impact Advisory Initiative, published by RMI and ZEROgrid

Assessing the Impact of Voluntary Actions on the Grid

Executive Summary

Over the past 10 years, voluntary procurement of clean energy by corporations has been a tremendous driver of renewable energy development. Since 2014, large companies have signed procurement contracts supporting the development of over 70 gigawatts of renewable energy in the United States,1 in addition to purchasing renewable energy certificates (RECs), providing tax equity financing, and advocating regionally and nationally for more clean energy deployment. These voluntary procurement trends are continuing to scale and expand into other markets such as Japan, South Korea, and Taiwan.2

The urgency of the climate crisis is prompting many large energy consumers to consider how they can assess the impact of various actions on grid decarbonization and reliability. Such an assessment can be best made using consequential emissions impact analysis, which employs various approaches to estimate the difference between total global emissions in different possible states of the world.

Although many authors have published on consequential emissions impact analysis, there have been different views and until now no joint statement from differing authors on areas of consensus and how to resolve discrepant conclusions.

To provide greater clarity to corporate actors, ZEROgrid created the Impact Advisory Initiative, or IAI. The IAI comprises a group of expert practitioners from the National Renewable Energy Laboratory (NREL), Princeton University, REsurety, RMI, and WattTime who collectively identified key points of consensus as well as areas requiring further research.i

This paper provides an overview of the IAI’s findings regarding emerging areas of consensus about consequential emissions impact analysis, its implications, and areas where further research is required.

Areas of Consensus:

  1. Defining Impact. The true impact of any voluntary corporate action (or any action) is the difference in total emissions between a world where the action was taken versus one in which it was not taken.
  2. Components of impact. This impact is the sum of several different contributing effects, which must include the effects over the lifetime of the intervention — how an intervention changes the short-run operations of power plants, and structural change, i.e., how it changes the total supply of different power plants in the long run — to fully capture the impact of an action.
  3. Estimates versus true values. The field has a number of ways to produce estimates of total emissions impact and its components. Although there is agreement regarding how changes to short-run operations can be quantified, the field currently lacks — and indeed may always lack — any generally accepted way to empirically verify estimates of structural change. Therefore, any approach that seeks to measure total impact has (potentially significant levels of) uncertainty.

i The ZEROgrid initiative brings together a group of corporate actors, including Akamai, General Motors, HASI, Meta, Prologis, Salesforce, and Walmart, seeking to drive deep decarbonization alongside increased power grid reliability and affordability, working in collaboration with emissions and reliability experts. Additional information is available at https://zerogrid.org/.

Download the policy brief

"*" indicates required fields

Name*
This field is for validation purposes and should be left unchanged.

View the brief on RMI’s website.

Return to the resources main menu.

Q1 2024 State of the Renewables Market Report

A view of Q1 2024 U.S. renewable energy performance

REsurety creates the State of the Renewables Market report every quarter to provide readers with data-driven insight into the value and emerging trends of renewable generation in U.S. power markets. Please fill out the form to access the full report, the Editor’s Note is below.

Editor’s Note:

REsurety's Devon Lukas
Devon Lukas
Lead Analyst
Senior Analyst, Analytics Services
REsurety's Carl Ostridge
Carl Ostridge
Editor
SVP, Analytics Services

Record-Breaking Winter for Solar: Behind The Scenes

Solar output in ERCOT has been in the news as of late, with the buzz around the record-breaking 17.2 GW peak on February 19th amplified by the 18.7 GW peak on March 28th. While impressive, these records are actually not broken as often, or by as much, as one might initially expect given the amount of recent solar buildout. The current generation record would be 300 MW higher were it not for the complex interactions between the weather, transmission infrastructure, and tax incentives.

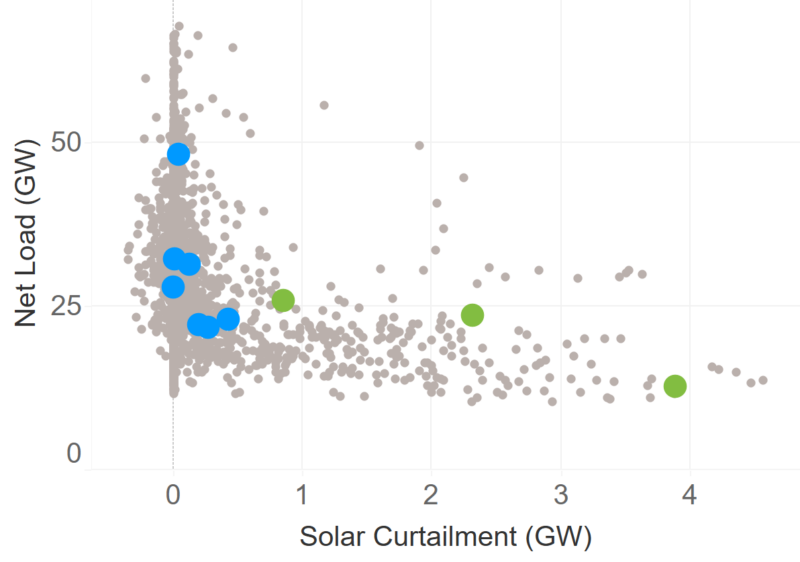
First, and perhaps most obviously, the weather impacts renewable generation and demand, and when there’s too much of the former and not enough of the latter, renewable projects are curtailed. Net load (total load minus renewable generation) is a useful metric to highlight this behavior. Figure 1 shows solar curtailment as a function of net load for Q1 2024. It’s clear that as net load drops below 20 GW, solar generation starts to be curtailed, increasing quickly as net load reduces further. These grid-wide supply and demand balancing issues that lead to renewable energy curtailment also play out on a local level, caused by transmission constraints. Even if there’s enough demand overall on the grid, if the renewable energy is located behind a transmission constraint, curtailment will still happen. Finally, there’s the tax incentives – wind projects tend to receive the Production Tax Credit (PTC) while solar projects tend to receive the Investment Tax Credit (ITC). Since the PTC is earned on a per megawatt-hour basis, many wind projects continue generating even when wholesale prices are negative. On the other hand, ITC-qualified solar projects will curtail as soon as wholesale prices become negative.

Figure 1: Net Load and Solar Curtailment, January – March 2024. Record-breaking periods shown in blue, missed records shown in green.

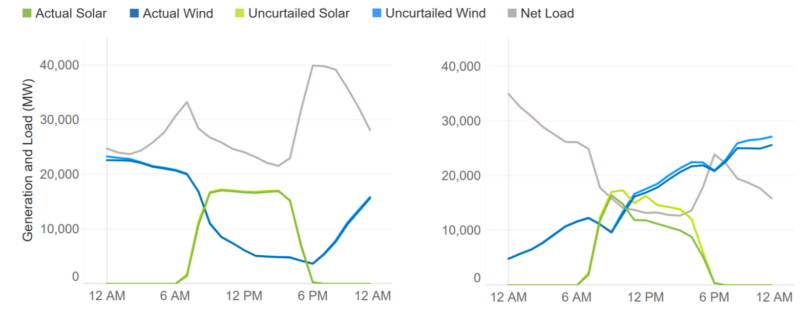
So, in terms of setting solar generation records, there needs to be an alignment of these variables – high solar generation potential, relatively low wind generation, relatively high load, and no meaningful transmission constraints. Figure 2 shows two days in February with different conditions and different outcomes. The first is February 19th, when there were favorable conditions and a new record was set – the skies were clear, wind output was low during the day, and net load stayed above 20 GW. A few days later on February 24th, conditions were not as favorable – skies were clear in the morning, but wind output was increasing and net load dropped below 20 GW. This meant solar projects were curtailed and while a new solar generation record 300 MW above the February 19th level could have been set, it was not.

Figure 2: Actual and Uncurtailed Solar and Wind on February 19th, 2024 (left) and February 24th, 2024 (right) Compared to Net Load (load minus actual wind and solar generation).

It’s also important to note the seasonality in these trends. The time of year makes these solar output records more unlikely – the first quarter of the year tends to be windy and load levels are on the low side too. As the summer approaches, wind generation will be lower on average and load will be higher. More solar projects will also likely be commissioned by then, so expect more records to be broken (and perhaps more frequently). Looking further forward, it will be interesting to see if some of the new solar projects elect for Production Tax Credits and therefore start to operate during periods of negative prices. If so, expect even more records to be set.

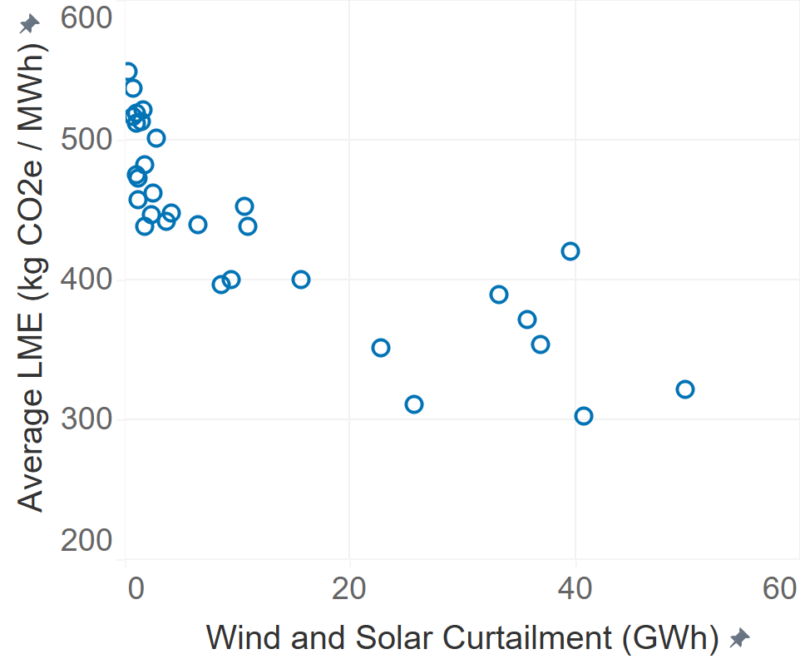
However, lost generation due to curtailment isn’t all doom and gloom. By definition, renewables make up a large proportion of the grid’s generation during periods of low net load and curtailment. For corporate buyers measuring their impact in emissionality terms, this means the ‘lost’ emissions impact due to curtailment is relatively small – most of that curtailed energy would have displaced other clean fuels (rather than fossil generators). This is especially true during periods of low net load, where high wind generation will keep marginal emissions rates low regardless of the level of solar curtailment. Figure 3 shows the average ERCOT Locational Marginal Emissions rate declining as renewable energy curtailments increase.

Figure 3: Daily Average ERCOT LME (kgCO2e / MWh) and Renewable Energy Curtailment in January, 2024.

As always with power markets, there’s a lot more going on behind the headlines of record breaking solar output.

In addition to downloading the report, you may want to watch a recording of a webinar on the Q1 report that we hosted in May, with the editor, Carl Ostridge, and lead analyst, Devon Lukas. They shared findings, insights, and hosted a live Q&A.

Q1 2024 Report Download

"*" indicates required fields

Name*
This field is for validation purposes and should be left unchanged.

Return to the blog post main menu.

Webinar Recording: Q1 2024 Quarterly Report Findings, Insight, and Q&A

REsurety logo

REsurety creates the State of the Renewables Market report every quarter to provide readers with data-driven insight into the value and emerging trends of renewable generation in U.S. power markets. We use our domain expertise in power markets, atmospheric science, and renewable offtake to analyze thousands of locations and summarize key findings.

In this webinar, editor Carl Ostridge and lead analyst Devon Lukas discussed the editor’s note, which examined how there’s more than meets the eye when it comes to ERCOT’s record-breaking solar generation. They also unpacked key findings highlighted in the Q1 2024 edition of the report, including recent trends and drivers behind renewable energy value across the U.S.

The session was interactive and there was an extensive Q&A session after the presentation. Watch the recording or read the transcript below.

About the speakers

Carl Ostridge, SVP, Analytics Services

REsurety's Carl Ostridge

Carl Ostridge has more than 15 years of energy experience, specializing in energy risk management, electricity markets, and renewable energy project performance. Prior to joining REsurety, Mr. Ostridge worked for DNV GL analyzing and improving the accuracy of wind farm energy analyses and developing models to predict wind farm energy output. His extensive industry experience and proven analytical skills support REsurety’s industry-leading tools and expertise in weather-related risk and valuation for renewable energy projects.
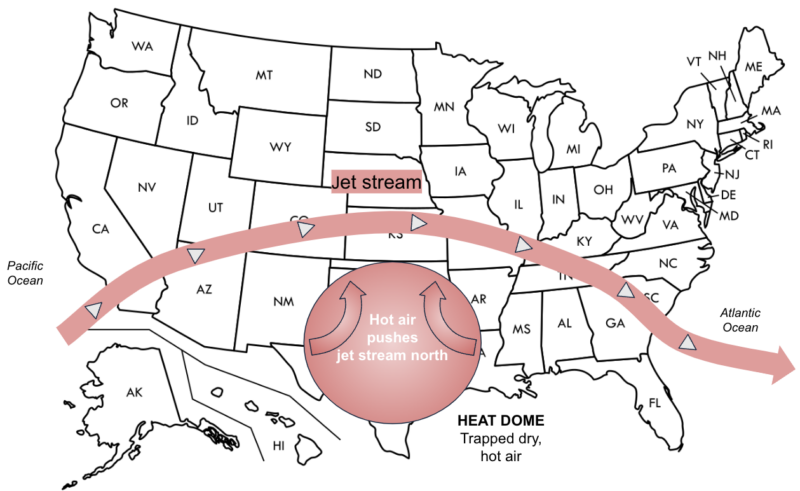
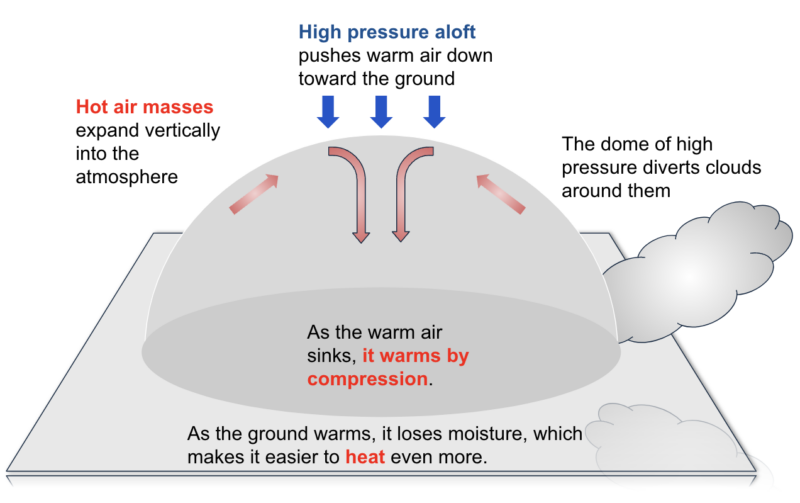
Mr. Ostridge holds a Master’s degree in Astrophysics from the University of Exeter in the UK.

Devon Lukas, Senior Analyst

REsurety's Devon Lukas

Devon Lukas is a data analyst with experience developing data visualization tools. Before joining REsurety, she conducted undergraduate research on floating offshore wind turbine structures, completed greenhouse gas emission analyses for the Pioneer Valley region of Massachusetts as well as the UMass Mount Ida campus, and developed various computational tools for renewable energy data sources. At REsurety, Devon is part of the pre-trade services team in which she primarily structures and analyzes weather-related risk mitigation contracts for clean energy buyers & sellers.

Devon holds a Bachelor of Science degree with a double major in Physics & Astronomy, and an integrated concentration in Renewable Energy from the University of Massachusetts in Amherst, Massachusetts.

Transcript