May 7, 2024
A view of Q1 2024 U.S. renewable energy performance
REsurety creates the State of the Renewables Market report every quarter to provide readers with data-driven insight into the value and emerging trends of renewable generation in U.S. power markets. Please fill out the form to access the full report, the Editor’s Note is below.
Editor’s Note:

Lead Analyst
Senior Analyst, Analytics Services

Editor
SVP, Analytics Services
Record-Breaking Winter for Solar: Behind The Scenes
Solar output in ERCOT has been in the news as of late, with the buzz around the record-breaking 17.2 GW peak on February 19th amplified by the 18.7 GW peak on March 28th. While impressive, these records are actually not broken as often, or by as much, as one might initially expect given the amount of recent solar buildout. The current generation record would be 300 MW higher were it not for the complex interactions between the weather, transmission infrastructure, and tax incentives.
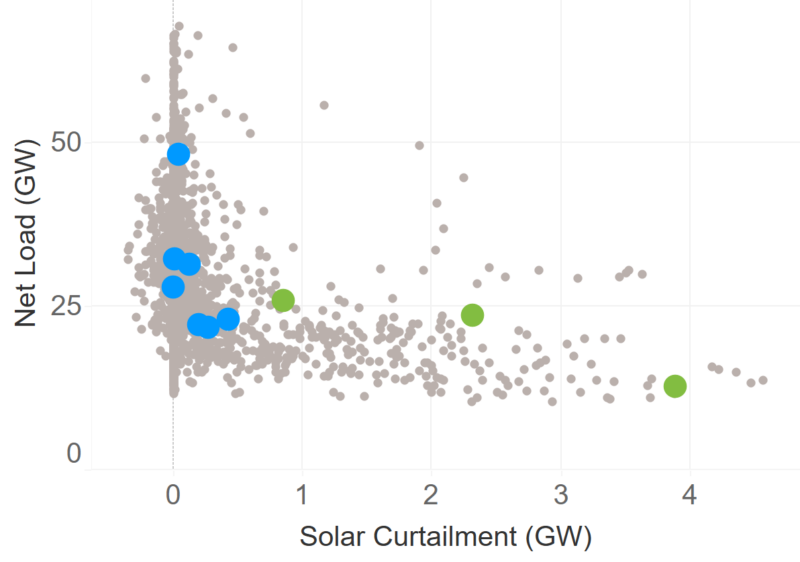
First, and perhaps most obviously, the weather impacts renewable generation and demand, and when there’s too much of the former and not enough of the latter, renewable projects are curtailed. Net load (total load minus renewable generation) is a useful metric to highlight this behavior. Figure 1 shows solar curtailment as a function of net load for Q1 2024. It’s clear that as net load drops below 20 GW, solar generation starts to be curtailed, increasing quickly as net load reduces further. These grid-wide supply and demand balancing issues that lead to renewable energy curtailment also play out on a local level, caused by transmission constraints. Even if there’s enough demand overall on the grid, if the renewable energy is located behind a transmission constraint, curtailment will still happen. Finally, there’s the tax incentives – wind projects tend to receive the Production Tax Credit (PTC) while solar projects tend to receive the Investment Tax Credit (ITC). Since the PTC is earned on a per megawatt-hour basis, many wind projects continue generating even when wholesale prices are negative. On the other hand, ITC-qualified solar projects will curtail as soon as wholesale prices become negative.
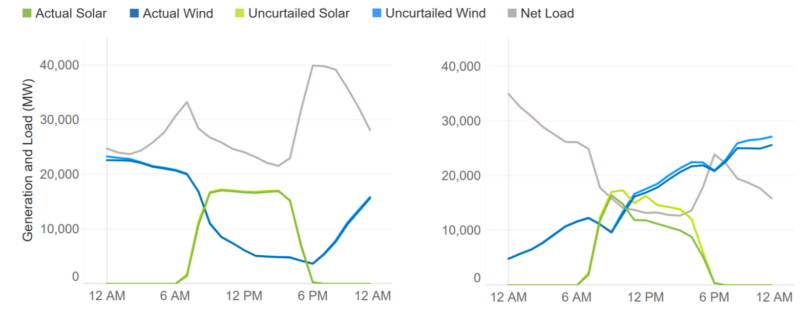
So, in terms of setting solar generation records, there needs to be an alignment of these variables – high solar generation potential, relatively low wind generation, relatively high load, and no meaningful transmission constraints. Figure 2 shows two days in February with different conditions and different outcomes. The first is February 19th, when there were favorable conditions and a new record was set – the skies were clear, wind output was low during the day, and net load stayed above 20 GW. A few days later on February 24th, conditions were not as favorable – skies were clear in the morning, but wind output was increasing and net load dropped below 20 GW. This meant solar projects were curtailed and while a new solar generation record 300 MW above the February 19th level could have been set, it was not.
It’s also important to note the seasonality in these trends. The time of year makes these solar output records more unlikely – the first quarter of the year tends to be windy and load levels are on the low side too. As the summer approaches, wind generation will be lower on average and load will be higher. More solar projects will also likely be commissioned by then, so expect more records to be broken (and perhaps more frequently). Looking further forward, it will be interesting to see if some of the new solar projects elect for Production Tax Credits and therefore start to operate during periods of negative prices. If so, expect even more records to be set.
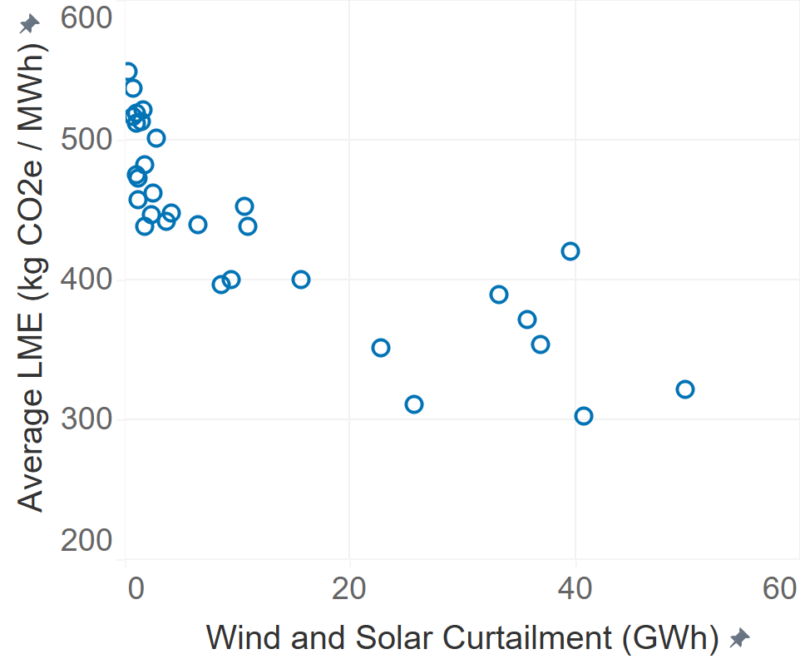
However, lost generation due to curtailment isn’t all doom and gloom. By definition, renewables make up a large proportion of the grid’s generation during periods of low net load and curtailment. For corporate buyers measuring their impact in emissionality terms, this means the ‘lost’ emissions impact due to curtailment is relatively small – most of that curtailed energy would have displaced other clean fuels (rather than fossil generators). This is especially true during periods of low net load, where high wind generation will keep marginal emissions rates low regardless of the level of solar curtailment. Figure 3 shows the average ERCOT Locational Marginal Emissions rate declining as renewable energy curtailments increase.
As always with power markets, there’s a lot more going on behind the headlines of record breaking solar output.
In addition to downloading the report, you may want to watch a recording of a webinar on the Q1 report that we hosted in May, with the editor, Carl Ostridge, and lead analyst, Devon Lukas. They shared findings, insights, and hosted a live Q&A.
Q1 2024 Report Download
"*" indicates required fields
Return to the blog post main menu.