Identify opportunities and evaluate risk
A map-based SaaS product that integrates weather and power market data at an unprecedented scale. Project and Carbon Explorer’s speed and ease of use saves you time.
From regional trend analysis to hourly project performance benchmarking, Project and Carbon Explorer deliver the breadth and depth of analysis you need, quickly and accurately, all with a couple of clicks. Project and Carbon Explorer leverage REsurety’s unique expertise at the intersection of atmospheric science, power market modeling and big data. Billions of data points are integrated, quality controlled and analyzed to provide the financial metrics that are critical to renewable energy decision makers’ success.
Project and Carbon Explorer Features
Historical and forecasted data
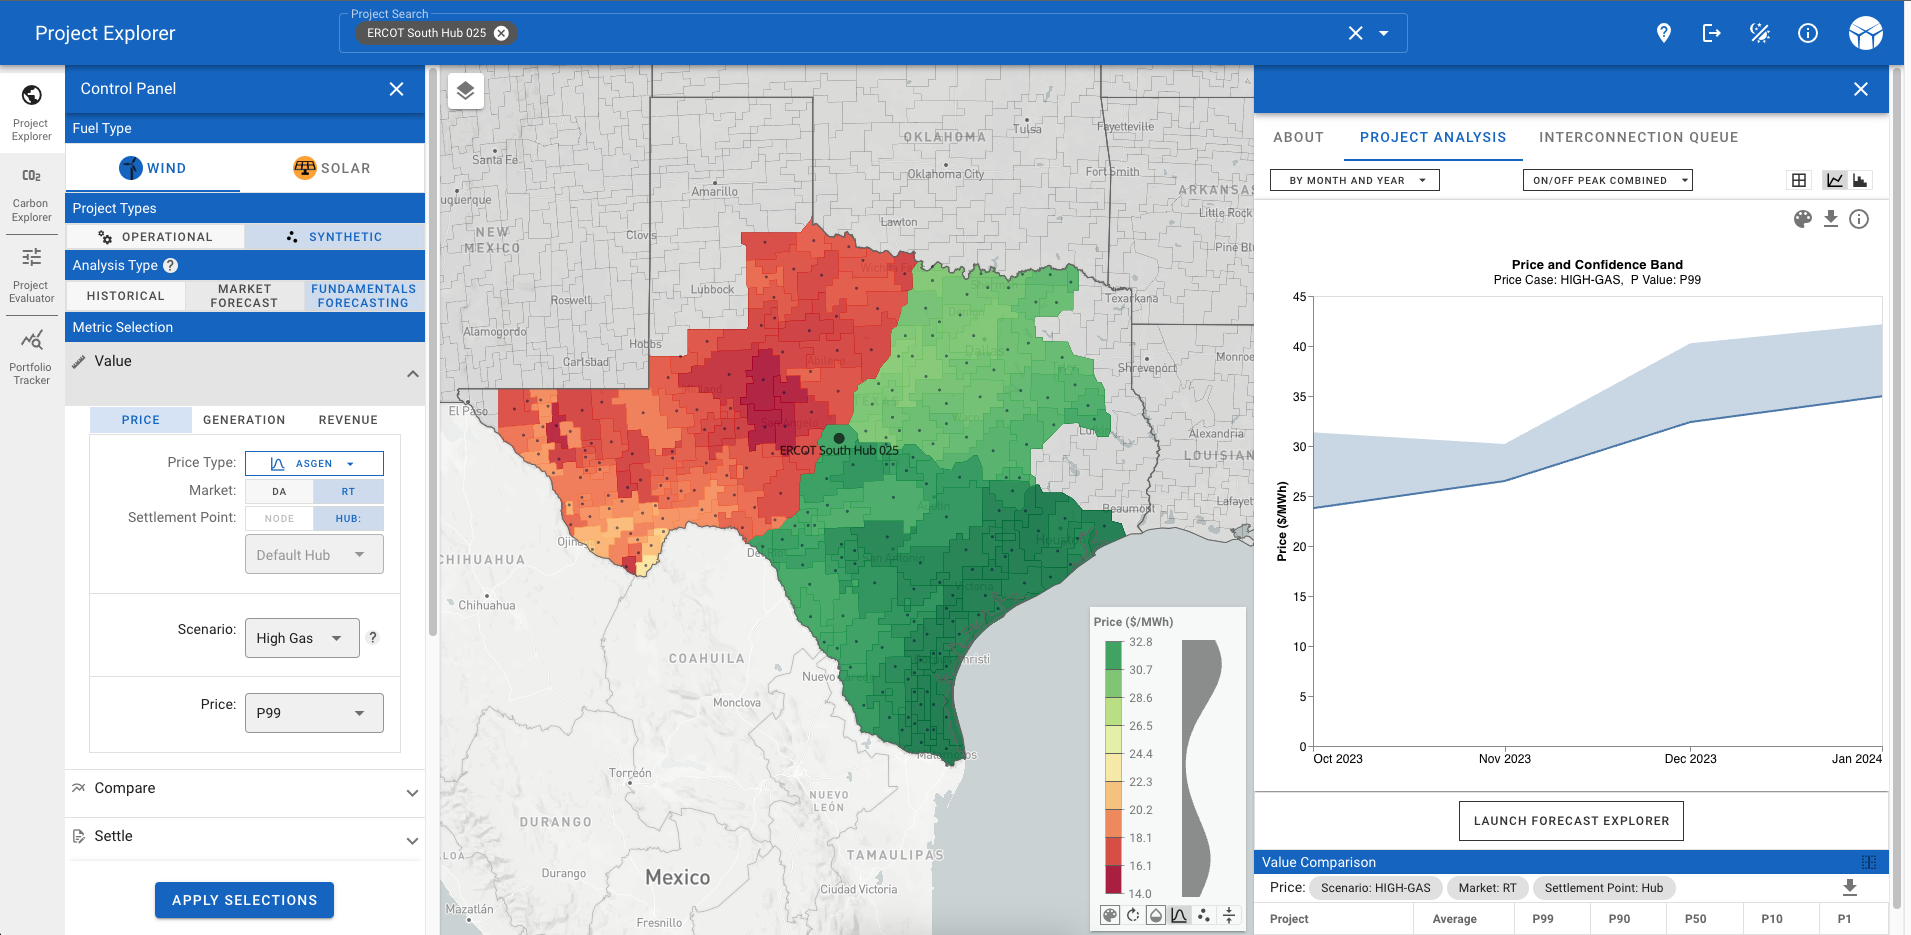
View historical price and generation data for any project up to 20 years into the past or 20 years into the future. Historical data can even be modeled to pre-date a project’s commission date to simulate a longer backcast of project performance. And forecasted power prices and generation are available across a range of power market conditions and weather scenarios to get a complete and realistic range of possible future outcomes.
Locational Marginal Emissions data
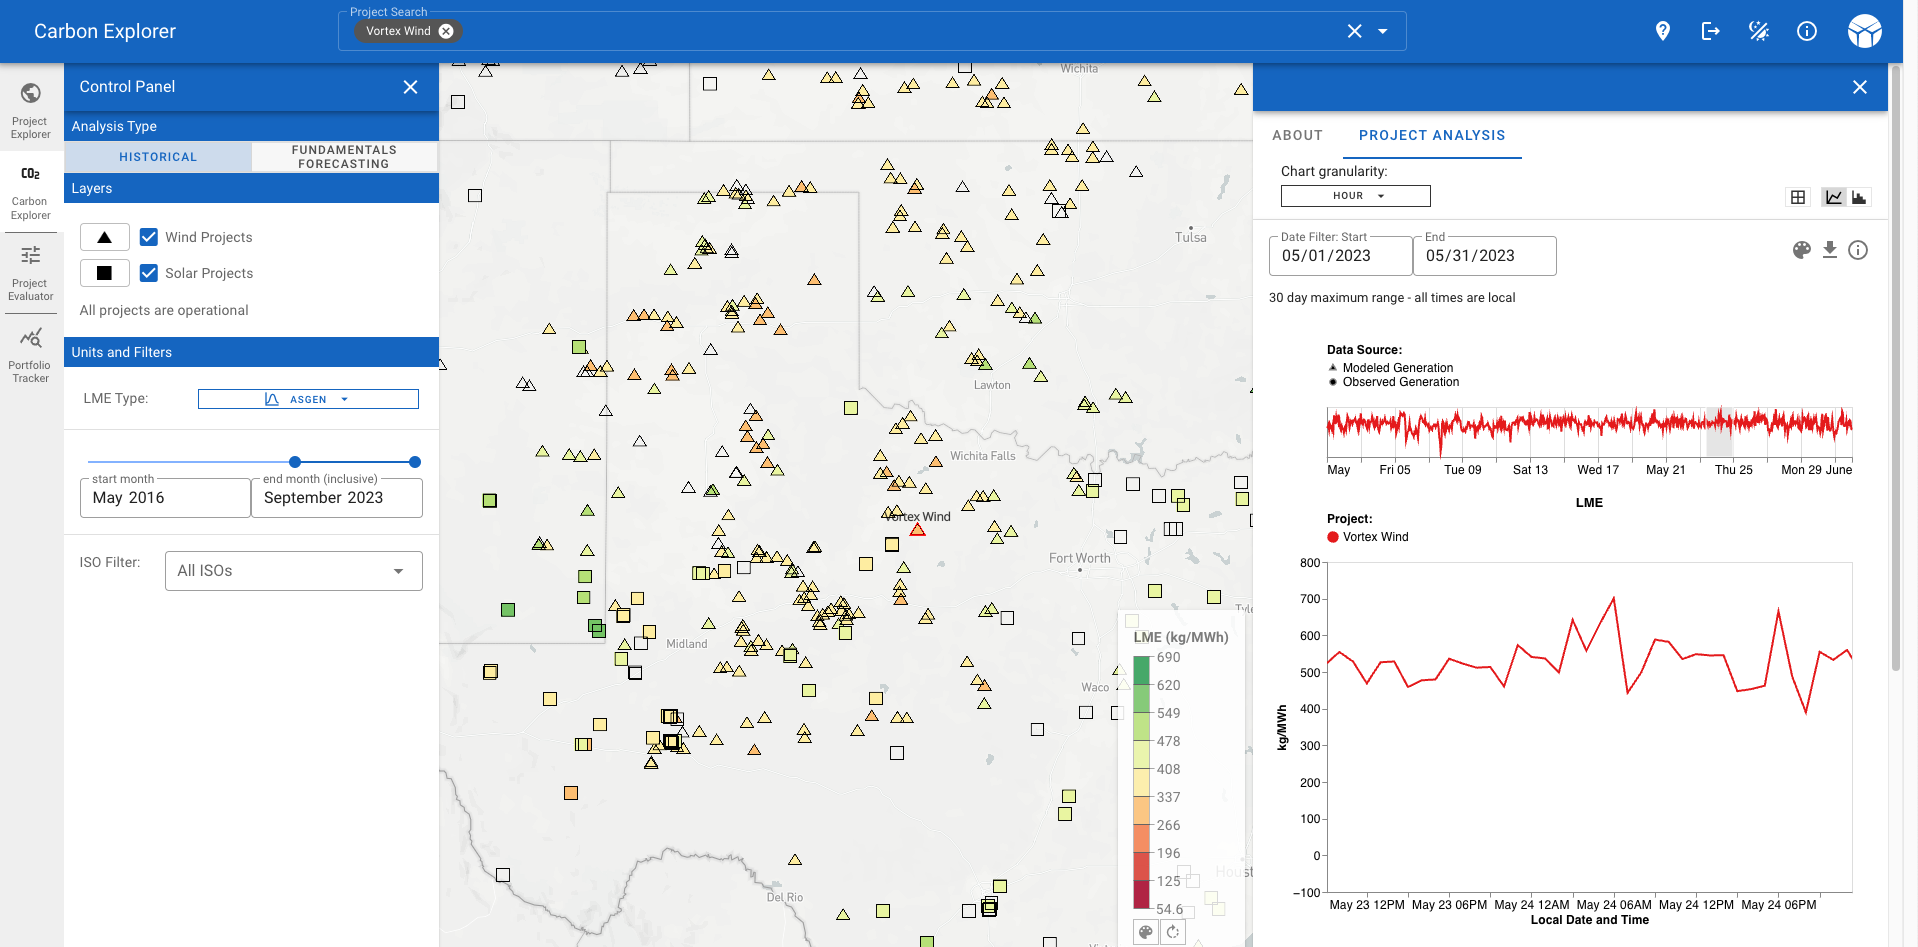
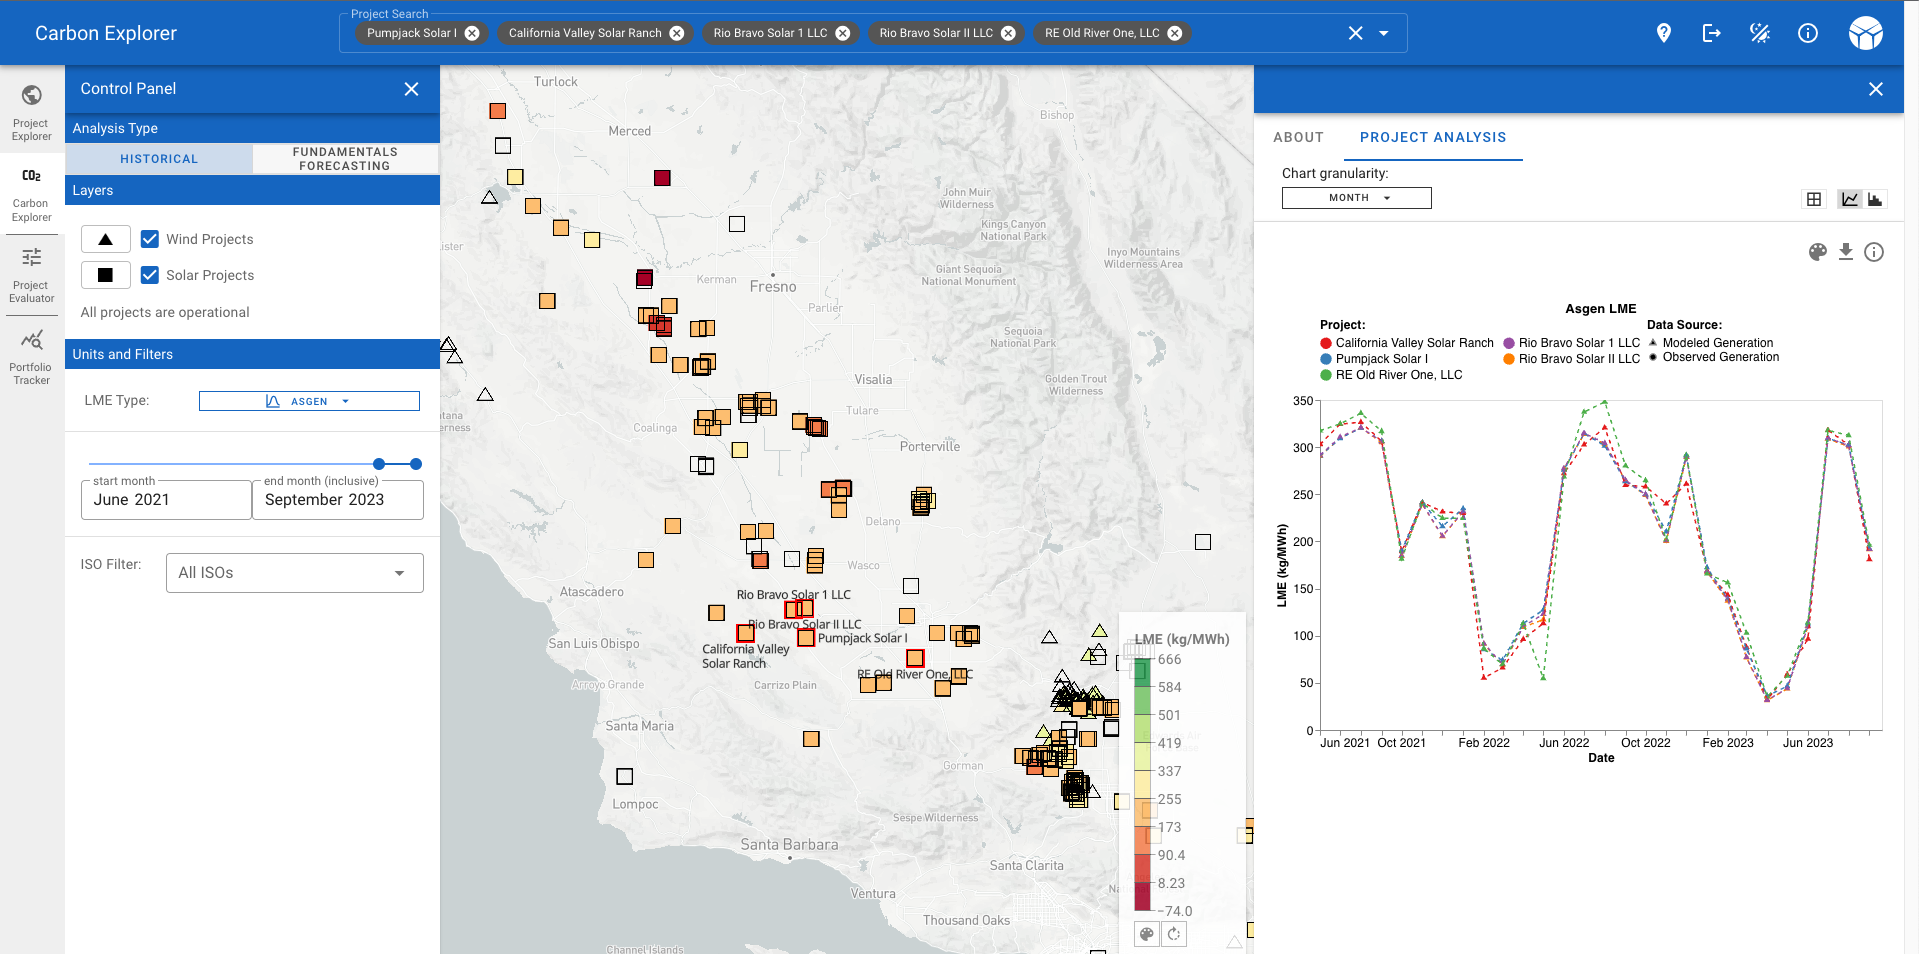
In addition to accessing generation and power market data across the entire United States, at all renewable project locations, Project and Carbon Explorer offer the ability to view and analyze historical and forecasted LME data for operational wind and solar projects in ERCOT, PJM, CAISO, MISO, SPP, NYISO, and ISONE. Quickly access high quality carbon emissions data paired with generation at the monthly and hourly level.
Any wind or solar project
Access detailed performance data for nearly 2,000 existing and operational projects. No existing project? No problem. Simulate a wind or solar project anywhere in the contiguous U.S. using our advanced modeling methodology. One solution provides complete geographic insight into the U.S. renewable energy market.
Data at the granularity you need
Temporal and geographic data available at multiple granularities and resolutions. Whether you’re looking for temporal data at the monthly, hourly or peak/off-peak level or geographic data for the county, hub or ISO, aggregate and disaggregate data to the resolution that makes sense for your business and decision-making needs.
Workflow integration
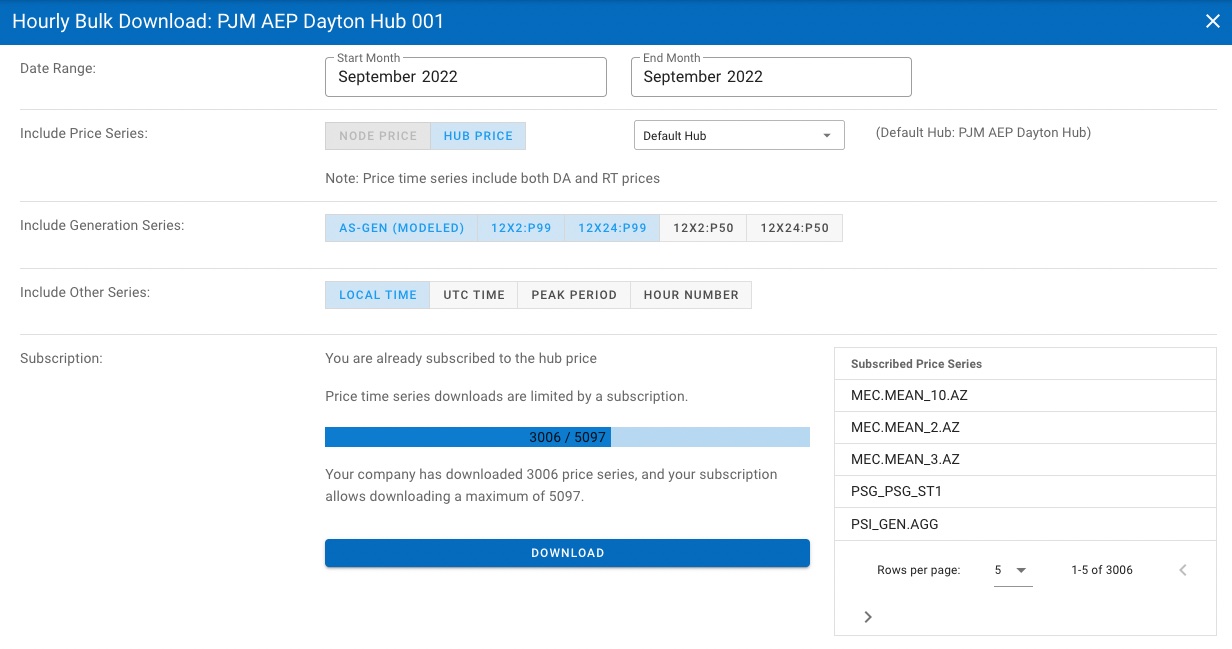
Put our data to work. Download data directly for ad-hoc reporting and presentation needs or integrate more fully using our API and your programming language of choice for a seamless workflow experience between other platforms or in-house analytical tools.
30+ project metrics
Metrics are made available at multiple levels to anticipate your needs. View metrics on an individual project level or across multiple projects or geographies to compare performance. Common metrics include Basis, Shape, Merchant Revenue, As-Gen Price, ATC Price, 12×2 Price, 12×24 Price, Negative Price, Generation, PPA settlement, FVS settlement and more.
Settlement simulation
Model the most common types of risk transfers in the market: fixed volume swaps and virtual PPAs. For fixed volume swaps, easily define your market, price type, hedge amount and view outcomes for both the short and long price perspectives. For virtual PPAs, easily define your market, settlement point, price and view outcomes from either a generator or offtaker perspective.
Analyze forecasted price performance of a synthetic project in ERCOT, using the High Gas market scenario and P99 price type.
Comparing historical carbon abatement levels for solar projects in CAISO.

Download project data ad-hoc across different time ranges with multiple metrics with the Hourly Bulk Download feature.

View hourly LME performance for a wind project in ERCOT by using the sweep chart to focus on a specific hour range.
Use Cases and Value
M&A sourcing & screening
Expand your pipeline and filter opportunities better, faster, cheaper.
Offtake comparison & analysis
Understand option set and evaluate on risk adjusted basis.
Business development
Understand your client’s opportunities and threats as well as – or better than – they do.
Procurement & RFP administration
Compare RFP submissions on an apples-to-apples, risk-adjusted basis.
Greenfield development
Expand your pipeline and filter opportunities better, faster, cheaper.
Hedge product indication
Start your discussions with precision: data-driven pricing estimates and comparative value.


