Category: Resources

Q4 2023 State of the Renewables Market Report

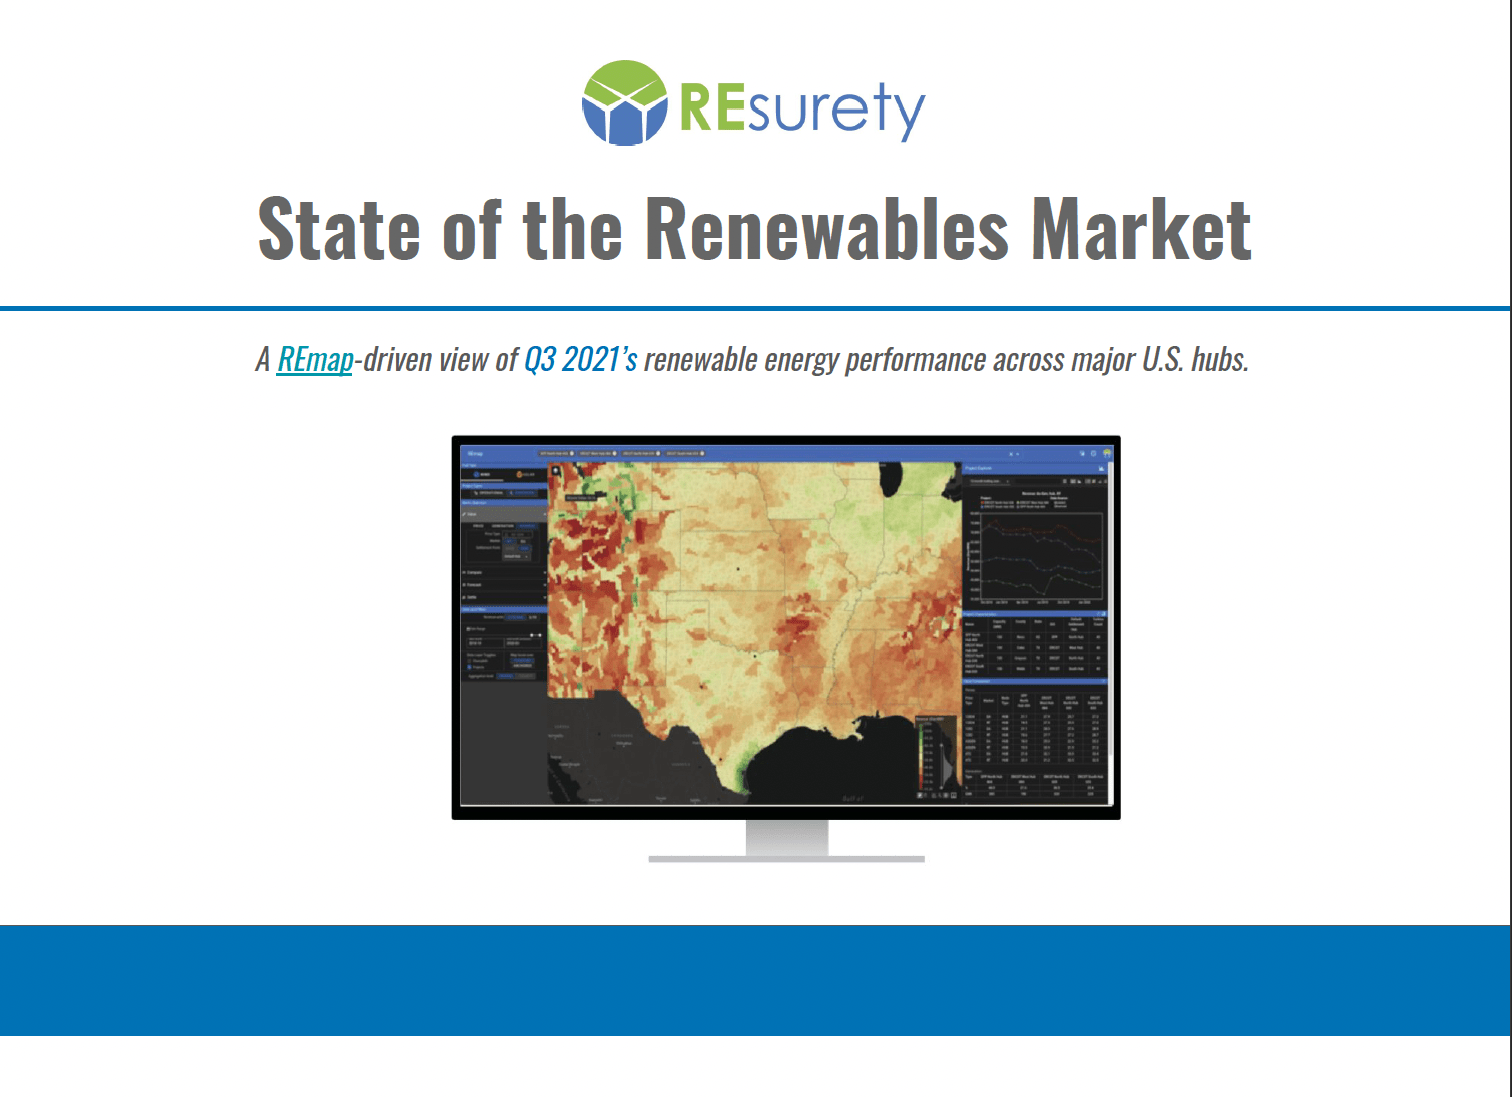
A view of Q4 2023 U.S. renewable energy performance

Q4 2023 State of the Renewables Market Report Cover

REsurety creates the State of the Renewables Market report every quarter to provide readers with data-driven insight into the value and emerging trends of renewable generation in U.S. power markets. Please fill out the form to access the full report, the Editor’s Note is below.

Editor’s Note:

REsurety's Devon Lukas
Devon Lukas
Lead Analyst
Senior Analyst, Analytics Services
REsurety's Carl Ostridge
Carl Ostridge
Editor
SVP, Analytics Services

Emissions (Rates) Ignore (ISO) Borders

As of the end of 2023, Locational Marginal Emissions data is available for all seven deregulated ISOs in the U.S. That additional data coverage is reflected in the later parts of this report. Here, we’re going to dig into what the data can tell us about the current state of the different ISOs and how it can shine a light on the current hydrogen-hourly matching debate.

All the data included in this analysis is for the period November 2022 – October 2023.

1. Renewables projects in CAISO, and particularly solar, had the lowest environmental impact.

There’s already a lot of solar power installed in California, and that means during the day when the sun is shining, solar power is often the marginal generator. That means incremental solar generation is displacing clean megawatt-hours from other solar projects, not fossil-based generators. The average renewable energy project in CAISO during this 12-month period displaced only 234 kgCO2e/MWh. That’s less than half the emissions impact of the average renewable energy project in PJM.

Figure 1: Locational Marginal Emissions Rates for wind and solar projects (kgCO2e/MWh), November 2022 - October 2023. Average, P5 and P95 values are shown.
Figure 1: Locational Marginal Emissions Rates for wind and solar projects (kgCO2e/MWh), November 2022 – October 2023. Average, P5 and P95 values are shown.

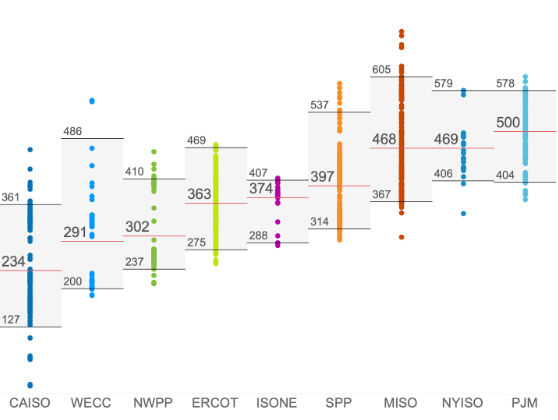
2. PJM is where renewable energy has the biggest environmental impact.

A combination of relatively low penetration rates for renewables and fewer transmission constraints means there’s an outsized impact for any new wind or solar project in the PJM footprint because it is often displacing fossil-based generators and rarely displacing other renewables. On average, a renewable energy project in PJM displaced 25% more CO2 than an equivalent project in SPP and almost 40% more than projects in ERCOT.

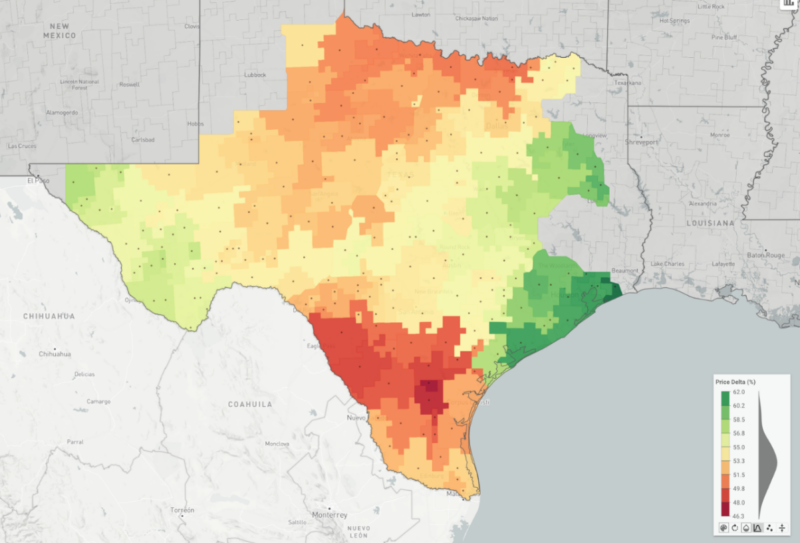
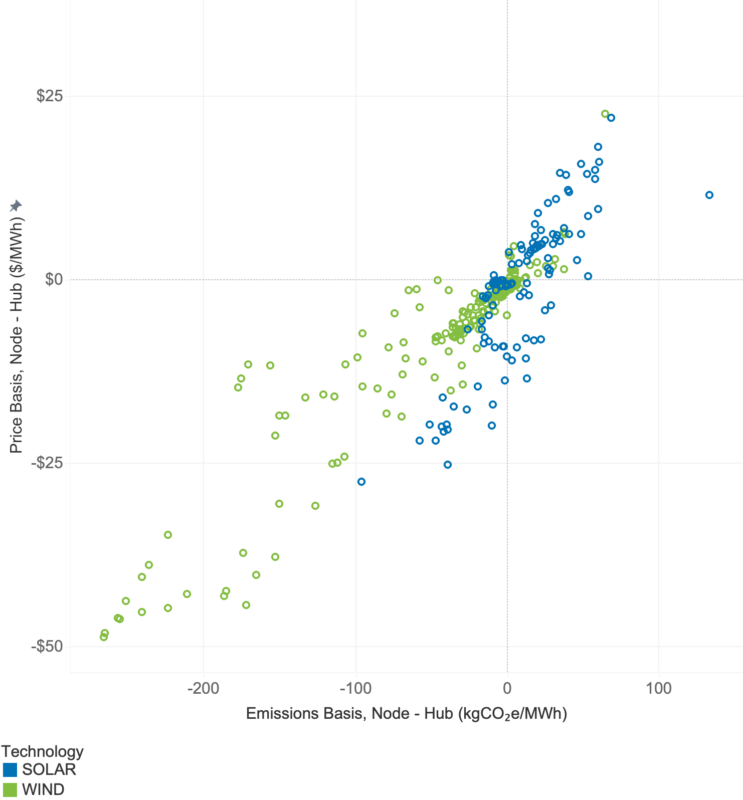
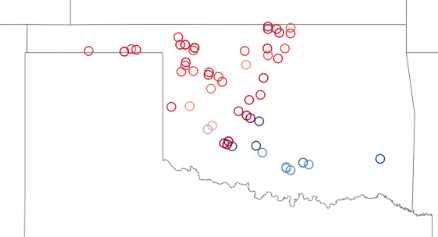
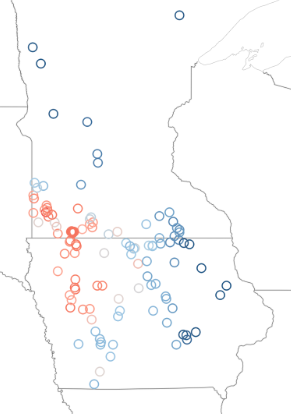
3. There is a huge range of emissions rates within most ISOs.

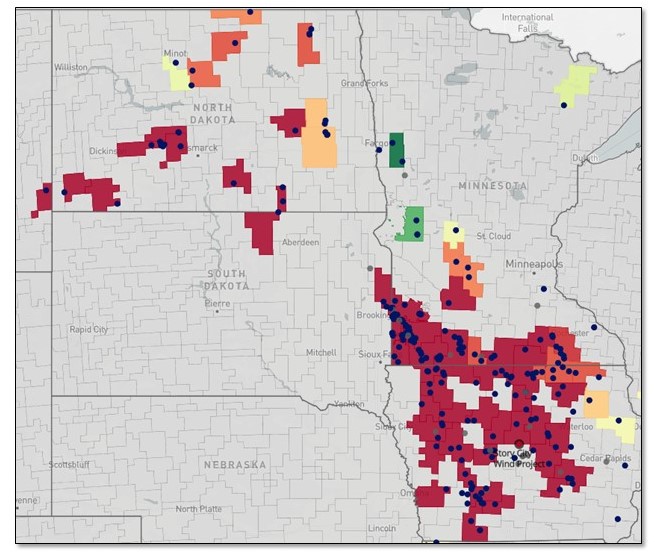
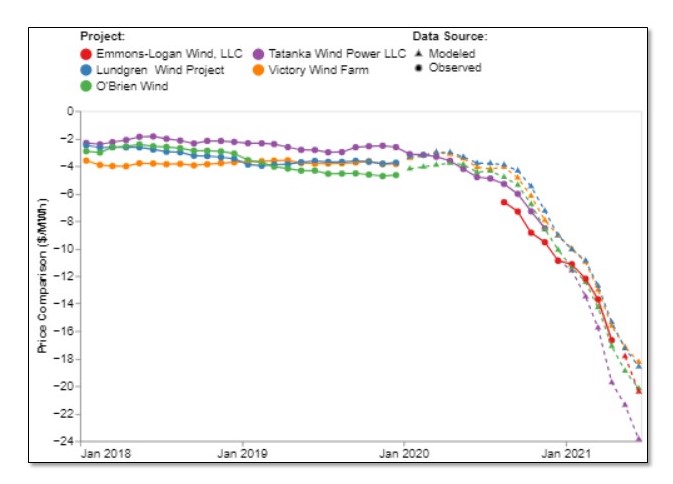
It’s perhaps more intuitive to make sense of the differences in average emissions impacts between ISOs – each has its own unique generation stack, load profile, and set of connections with neighboring regions, resulting in different emissions rates for renewables. However, there’s an even bigger range of emissions rates within these regions. This is primarily driven by the unique local transmission constraints within each region and how each of these constraints affects the ability of renewable generation to meet load. Two examples of localized variability in emissions impact are shown in figures 2 and 3. In both southern Oklahoma and western Minnesota, the emissions impact of wind projects is reduced due to local transmission constraints and congestion.

Figure 2: Locational Marginal Emissions, Oklahoma Wind Generators, November 2022 - October 2023.
Figure 2: Locational Marginal Emissions, Oklahoma Wind Generators, November 2022 – October 2023.
Figure 3: Locational Marginal Emissions, Iowa and Minnesota Wind Generators, November 2022 - October 2023.
Figure 3: Locational Marginal Emissions, Iowa and Minnesota Wind Generators, November 2022 – October 2023.

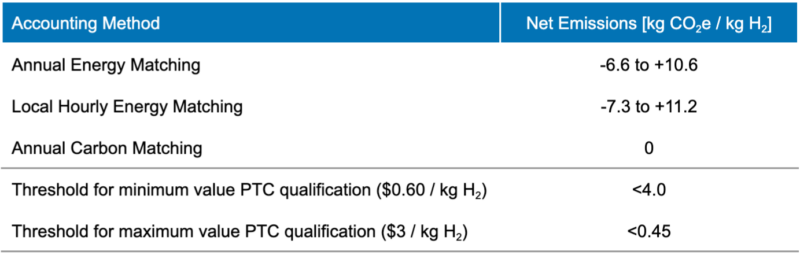
This last point about intra-regional variability is interesting for a number of reasons, but one to specifically call out here is the current debate around the IRS guidance for hourly matching of renewables for hydrogen electrolyzers under Section 45V of the Internal Revenue Code. The latest IRS proposal requires hourly matching of electrolyzer consumption with renewable energy procured within the same ‘region’. While the hourly matching regions don’t precisely match ISO boundaries, they’re pretty close. Therefore, the intra-regional variation in emissions impact for renewable energy projects would likely translate directly to the real-world emissions associated with ‘green’ hydrogen. An electrolyzer could procure renewable energy from a high-performing project in the region and avoid a lot more carbon than the electrolyzer consumes. The more worrying possibility is the opposite scenario – buying power from an underperforming project could mean that the hydrogen produced is actually far from ‘green’.

In addition to downloading the report, you may want to register to attend a webinar on the topic on Wednesday, February 7 at 1pm ET with the editor, Carl Ostridge. He’ll share findings, insights, and host a live Q&A.

Q4 2023 Report Download

"*" indicates required fields

Name*
This field is for validation purposes and should be left unchanged.

Return to the blog post main menu.

Q3 2023 State of the Renewables Market Report

A view of Q3 2023 U.S. renewable energy performance

REsurety Q3 2023 State of the Renewables Market Report

REsurety creates the State of the Renewables Market report every quarter to provide readers with data-driven insight into the value and emerging trends of renewable generation in U.S. power markets. Please fill out the form to access the full report, the Editor’s Note is below.

Editor’s Note:

REsurety's Devon Lukas
Devon Lukas
Lead Analyst
Senior Analyst, Analytics Services
REsurety's Carl Ostridge
Carl Ostridge
Editor
SVP, Analytics Services

A Tale of Two Technologies

When I think of Southwest Power Pool (SPP) I think of wind. Wind met almost 40% of SPP demand in 2022 and new output records have been consistently set over the past couple of years. When I think of SPP I don’t think of solar, though. Solar met less than 0.5% of SPP demand in 2022. And I’ve always found that a little surprising considering the southern SPP footprint has some of the best solar resource in the country (ref: NREL). Maximum solar output this summer in SPP was only 30 MW higher than 2022 while the equivalent metric in ERCOT increased by more than 3,500 MW.

The abundance of wind generators and the lack of solar also means the two technologies look very different when considering two important metrics – the monetary value and the decarbonization impact of each MWh.

Figure 1 shows the capture rates (the value of the wind or solar-weighted MWh compared to around-the-clock MWh) for both price and emissions intensity. We see similar trends in both – wind is capturing less and less of the available monetary value and avoiding less and less CO2 while the opposite is true for solar.

Price and Emissions Intensity Capture Rate, 12-month rolling average. Uses representative modeled wind and solar generation data. February 2021 excluded.
Figure 1: Price and Emissions Intensity Capture Rate, 12-month rolling average. Uses representative modeled wind and solar generation data. February 2021 excluded.

To understand what’s causing this we can look at the month-hour average prices and emissions rates over the past four years. We see that both prices and emissions rates are highest during the summer afternoons. During these times load is high and often wind output is low, meaning the marginal unit is a thermal generator with higher emissions rates. Of course, these are the same hours when solar output is peaking and that correlation leads to high solar value (in $ and CO2 avoidance terms) compared to an around-the-clock generation profile. Conversely, the low prices and low emissions rates are occurring (not coincidentally) in hours of high wind output and this drives the prices and emissions rates lower.

Average Real-Time Price and Emissions Rate 12x24, SPP South.
Figure 2: Average Real-Time Price and Emissions Rate 12×24, SPP South.

On the face of it, this means adding solar to SPP would be a win-win, it would capture relatively high value power prices and would displace thermal generators more often, avoiding more carbon emissions. In Q3 of this year, solar was worth more than $50/MWh at South Hub while wind was worth closer to $20/MWh. During the same period, solar generation also had a 40% larger emissions reduction impact compared to wind.

Price and Emissions Values for Wind and Solar in Q3 2023.
Table 1: Price and Emissions Values for Wind and Solar in Q3 2023.

So why aren’t more solar projects being built? There are a number of challenges, but transmission is a considerable one. The interconnection queue is long and growing thanks to the IRA, and getting an interconnection agreement often requires developers to share large upgrade costs. Further, this analysis reflects the hub values for prices and emissions. Wind projects in SPP suffer some of the worst price basis in the country with some projects seeing $10-20/MWh annual nodal discounts vs. the hub. Investment tax credit (ITC)-qualified solar projects would likely need to curtail output as soon as prices reach negative territory while production tax credit (PTC)-qualified wind projects tend to continue operating far beyond that point.

There’s currently value available for solar in SPP but only if project developers can navigate the complex issues related to transmission, interconnection, and congestion.

Q3 2023 Report Download

"*" indicates required fields

Name*
This field is for validation purposes and should be left unchanged.

Return to the blog post main menu.

Q2 2023 State of the Renewables Market Report

A view of Q2 2023 U.S. renewable energy performance

Q2 2023 State of the Renewables Market

REsurety creates the State of the Renewables Market report every quarter to provide readers with data-driven insight into the value and emerging trends of renewable generation in U.S. power markets. We use our domain expertise in power markets, atmospheric science, and renewable offtake to analyze thousands of locations and summarize key findings here. All of the data behind this analysis is curated by REsurety’s team of experts and available via our software products. It includes aggregated metrics for wind and solar projects operating in the U.S. All summaries are calculated using hourly-level data, and all energy-weighted price metrics are calculated using concurrent weather-driven generation and energy price time series. Please fill out the form at the bottom of the page to access the full report, the Editor’s Note is below.

Editor’s Note:

Devon Lukas, Lead Analyst of the State of the Renewables Market report
Devon Lukas
Lead Analyst
Senior Analyst, Analytics Services
Irina Gumennik, Editor of the State of the Renewables Market report
Irina Gumennik
Editor
Director, Analytics Services

June in Texas: High Heat, Not So High Power Prices

I recall the buzz during the summer of 2019 when power prices in ERCOT reached $9,000/MWh for a few hours and the speculation about how prices may have been lower with more solar on the grid. Fast forward to 2023. The hot topic to start the hot summer is instead how power prices may have been even higher without the observed solar generation. Solar energy’s contribution to grid resilience during this summer’s heat waves has even become mainstream news, with headlines about the absence of the power supply scares of previous summers.1

Indeed, solar capacity in ERCOT has grown over the last few years. Observed hourly solar generation regularly approached 13,000 MWh heading into this summer, compared to a maximum of approximately 10,000 MWh the same time last year (Figure 1). However, despite record breaking demand and a few hours of scarcity prices in June, the average monthly prices remained below the values from last summer (Figure 2). The average power price in June 2023 at ERCOT North Hub was $2 less than in June 2022 despite exceeding the monthly peak demand record by over 4,000 MW.2

Figure 1: Observed Hourly Solar Generation in ERCOT
Figure 2: Average Monthly Power Prices at ERCOT North Hub.

REsurety estimates that the average power price in ERCOT this June would have been nearly double the observed value without the additional solar generation. We also estimate that solar resources would have captured 27 percent more of this higher average monthly price, while wind resources would have captured 14 percent less.

Continued growth in solar capacity is expected to further degrade the capture rates for solar in ERCOT, while supporting capture rates for wind and keeping average prices lower for consumers. REsurety’s Weather-Smart fundamentals power price model shows reductions in solar value as solar buildout ramps up and the highest price hours are pushed out to the early mornings and evenings. At the same time, the reduction in power prices during afternoon hours also helps to limit downside risk to wind generation value. The lowest wind capture rates tend to occur in months that experience periods of low wind resource coinciding with periods of high demand from high temperatures.

We continue to watch how solar energy resources will perform with more hot weather still to come. Regardless of how the rest of this summer turns out, the impact that increasing solar penetration is having on markets like ERCOT is already apparent, and increasingly suggests that the near future is fundamentally different from the recent past. We will keep sharing our data findings in these quarterly reports as well as trends and thought leadership on our corporate blog.


Footnotes:

  1. The U.S. Power Grid Withstands the Heat, So Far: Electric supplies from renewable energy, hydropower and batteries bolster vulnerable parts. The Wall Street Journal, July 23, 2023.
  2. Based on available peak demand records for June 2023 reported by ERCOT.

Q2 2023 Report Download

"*" indicates required fields

Name*
This field is for validation purposes and should be left unchanged.

Return to the blog post main menu.

White Paper: Charging Towards Zero

Harnessing Batteries and Carbon Contracts to Accelerate Grid Decarbonization, authored by Tierra Climate in partnership with REsurety

White Paper - Charging Towards Zero: Harnessing Batteries and Carbon Contracts to Accelerate Grid Decarbonization

This paper examines the economic carbon impact of compensating batteries for carbon reduction using detailed electricity emissions data and a carbon contract. Carbon contracts with grid-scale batteries might provide corporations with an elegant solution to meet sustainability targets and decarbonize the electricity grid, which cannot be accomplished through renewable energy purchases alone.

In partnership with REsurety, the paper leverages REsurety’s Locational Marginal Emissions dataset as part of the calculating mechanism.

Return to the blog post main menu.

White Paper: Emissions Implications for Clean Hydrogen Accounting Methods

Authored by Carl Ostridge and Devon Lukas

Executive Summary

REsurety uses Locational Marginal Emissions (LMEs) data to analyze the effectiveness of the three carbon accounting methods proposed for compliance with new production tax credits available for clean hydrogen under the Inflation Reduction Act (IRA). This analysis considers 32 electrolyzer-renewable project pairs across 3 different grid regions (ERCOT, PJM, and CAISO) using hourly emissions and generation data from 2022. Seen in Table 1 below, the results show that, due to the difference in carbon intensities on the grid based on location and timing, determining “clean” hydrogen using Annual Energy Matching often results in significant increases in emissions despite the procurement of an equivalent quantity of energy from offsite clean energy to match the electrolyzer’s consumption. Further, Table 1 shows that while Local Hourly Energy Matching can help reduce net emissions in some locations, the impact of local transmission constraints often results in significant increases in net emissions even after energy is “matched” by hour. Finally, the Annual Carbon Matching method, using LME data, can ensure low or zero net emissions and qualification for the clean hydrogen production tax credit. The Annual Carbon Matching method also helps to incentivize development of electrolyzers in locations with cleaner grids with lower existing marginal emissions and the procurement of renewable energy in locations with dirtier grids and higher existing marginal emissions, therefore maximizing the ‘greening of the grid’ impact of the IRA legislation.

Net emissions ranges for the three proposed accounting methods.
Table 1: Net emissions ranges for the three proposed accounting methods.

Fill out the form to access the full paper and accompanying resource.

"*" indicates required fields

Name*
This field is for validation purposes and should be left unchanged.

Q1 2023 State of the Renewables Market Report

A view of Q1 2023 U.S. renewable energy performance

Q1 2023 State of the Renewables Market Report

REsurety creates the State of the Renewables Market report every quarter to provide readers with data-driven insight into the value and emerging trends of renewable generation in U.S. power markets. We use our domain expertise in power markets, atmospheric science, and renewable offtake to analyze thousands of locations and summarize key findings here. All of the data behind this analysis is curated by REsurety’s team of experts and available via our software products. It includes aggregated metrics for wind and solar projects operating in the U.S. All summaries are calculated using hourly-level data, and all energy-weighted price metrics are calculated using concurrent weather-driven generation and energy price time series. Please fill out the form at the bottom of the page to access the full report, the Editor’s Note is below.

Devon Lukas, Lead Analyst of the Q1 2023 State of the Renewables Market Report
Devon Lukas
Lead Analyst
Senior Analyst, Analytics Services – Pre-Trade Services
Carl Ostridge, Editor of the Q1 2023 State of the Renewables Market Report
Carl Ostridge
Editor
SVP of Analytics Services

Editor’s Note:

Ups and Downs on the Power Market Rollercoaster

For me, the story of 2022 was the high average power prices across the U.S. Emphasis on average because the high prices were not driven by individual large weather or market events like Winter Storm Uri in 2021. Yes, there were some weather-linked events, but these really didn’t move the needle at the annual level. The real driver in 2022 was the underlying price of natural gas – Henry Hub prices started the year at ~$4/MMBtu (already high compared to the last few years) and peaked close to $9/MMBtu in the summer. That’s by far the highest natural gas price seen in the post-shale era of the last 14 or so years.

Figure 1: Historical Henry Hub Natural Gas Spot Prices ($/MMBtu)
Figure 1: Historical Henry Hub Natural Gas Spot Prices ($/MMBtu).

Natural gas is often the marginal fuel in many regions and there’s a strong correlation between natural gas prices and power prices as shown in Figure 2. The historic natural gas prices during 2022 also resulted in power prices reaching their highest annual average in at least the last decade (Winter Storm Uri’s influence in February 2021 excluded).

Figure 2: Natural Gas and Power Prices indexed to 2011-2022 averages (Feb 2021 excluded).

Those high prices led to large payouts to merchant projects and clean energy buyers. For example, a typical 100 MW wind project with a $30/MWh PPA settling at ERCOT West would’ve paid more than $2M to their buyer by the end of the year. An equivalent vPPA settling at SPP South would’ve paid out more than $3M.

Now, fast forward to Q1 2023 and the world looks very different. Gas prices have dropped more than 50% compared to Q4 2022 and 40% compared to Q1 2022. Power prices in most markets have seen similar decreases, down 20-50% compared to Q1 of last year. That means the same vPPAs that were paying large sums to buyers throughout 2022 are now back to paying the projects. In some cases, buyers cut checks to projects in Q1 that exceeded the checks that they received during the whole of 2022.

Table 1: Example Wind and Solar vPPA settlements for calendar year 2022 and Q1 2023

The volatility seen in commodity and power markets in the past 18 months is expected to continue. Natural gas fundamentals, new generation interconnection, supply chain challenges, geopolitical turmoil, and increasingly extreme weather are expected to continue causing large ups and downs in the markets and that, of course, means ups and downs for those buying and selling power.

To understand the contributions of the three primary drivers of changing prices and volatility – grid composition, commodity prices, and weather – REsurety publishes Weather-Smart fundamentals power price forecasts each quarter. For the next 20 years the forecasts account for multiple commodity scenarios and for each of those scenarios models how the grid and market will reach under weather conditions representing each of the past 40 years. For example, we forecast this summer’s prices under ‘mid’, ‘low’, and ‘high’ gas scenarios and if the heat of 2011 or the relatively mild weather of 2007 was repeated (and every set of summer conditions in between). This provides a unique view of how both the commodity prices and weather drive market outcomes.

The model predicts there’s approximately a 3x range between the highest and lowest prices averaged for the remainder of 2023. That’s the difference between having a vPPA pay out to the buyer at similar levels to 2022 or continue to pay out to the project in line with Q1 of this year. With this level of volatility, the clichéd investment disclaimers certainly ring true – “past performance is not a guarantee of future performance and prices may go up as well as down.”

At REsurety we’ll be keeping a close eye on how both the commodity markets and weather unfold over the coming months and keeping our Weather-Smart forecasts up to date with the latest data.

Q1 2023 Report Download

"*" indicates required fields

Name*
This field is for validation purposes and should be left unchanged.

Return to the blog post main menu.

White Paper: Paths to Carbon Neutrality

Paths to Carbon Neutrality - A Comparison of Strategies for Tackling Corporate Scope II Carbon Emissions

A Comparison of Strategies for Tackling Corporate Scope II Carbon Emissions, published by Tabors Caramanis Rudkevich

White Paper: Paths to Carbon Neutrality - A Comparison of Strategies for Tackling Corporate Scope II Carbon Emissions, published by Tabors Caramanis Rudkevich

The purpose of this paper is to provide a comprehensive, comparative study covering a variety of factors impacting the cost and implementation of corporate clean energy procurement strategies.

Read the excerpt below to learn more.

Global climate change has pushed carbon emissions to the forefront of public scrutiny and scientific inquiry. Striving to reduce their net carbon footprint, large energy consumers have increasingly turned to renewable energy resources. These energy consumers have pioneered different approaches toward clean energy procurement, such as the RE100 initiative, Google’s 24/7 Carbon-Free Energy, Microsoft’s 100/100/0 vision, and the Emissions First partnership led by Meta and Amazon. This white paper examines different clean energy procurement strategies in terms of overall cost and effectiveness in carbon emissions reduction.

Using locational marginal emission rate (LMERs), we quantify the cost and carbon emissions impact of clean energy procurement strategies for corporate energy consumers with varying load shapes and within a variety of balancing authorities. We compare energy matching strategies against a strategy that directly accounts for carbon emissions, which we call carbon matching, for two different types of large electricity consumers in 5 different balancing authorities. Balancing authorities ranged from large ISO/RTOs (PJM and CAISO) to vertically integrated utility regions covering a regional (Duke Energy Carolinas) or municipal area (Los Angeles Department of Water and Power and Portland General Electric). 

The results show the following:

  • Carbon matching, a strategy that directly accounts for carbon emissions using LMERs and ensures that avoided emissions are equal or greater than emissions attributable to load, is more cost-effective than any of energy matching strategies analyzed;
  • Energy matching does not guarantee reaching carbon neutrality;
  • Localized energy matching decreases carbon displacement efficiency;
  • Local energy matching may not be practical in certain regions, which could deter participation;
  • Hourly energy matching is the least efficient strategy at displacing carbon emissions, and its cost varies greatly depending on location


If you’d like to learn more about REsurety’s Location Marginal Emissions (LMEs) offerings, please contact us.

Return to the blog post main menu.

White Paper: Carbon Confidence in Climate Finance, as published by HASI

“LME is an important tool in assessing individual projects because seemingly identical renewable energy projects can have drastically different impacts on avoided carbon emissions.”

White Paper: Carbon Confidence in Climate Finance, as published by HASI

CarbonCount is a decision tool that evaluates investments in U.S.-based renewable energy, energy efficiency, and climate resilience projects to determine how efficiently they reduce CO2 equivalent (CO2e) emissions per $1,000 of investment. CarbonCount produces a quantitative impact assessment for investments’ carbon avoidance by integrating forward-looking project assumptions, emissions factors, and capital investment.

This white paper explains why CarbonCount matters, why it’s being updated, the methodology behind it, and use cases. REsurety’s Locational Marginal Emissions (LME) data is also featured in the paper.

Learn more here, or download the full white paper below.

Return to blog post main menu.

Q4 2022 State of the Renewables Market Report

Carl Ostridge

A view of Q4 2022 U.S. renewable energy performance

REsurety State of the Renewable Market report

REsurety creates the State of the Renewables Market report every quarter to provide readers with data-driven insight into the value and emerging trends of renewable generation in U.S. power markets. We use our domain expertise in power markets, atmospheric science, and renewable offtake to analyze thousands of locations and summarize key findings here. All of the data behind this analysis is curated by REsurety’s team of experts and available via our software products. It includes aggregated metrics for wind and solar projects operating in the U.S. All summaries are calculated using hourly-level data, and all energy-weighted price metrics are calculated using concurrent weather-driven generation and energy price time series. Please fill out the form at the bottom of the page to access the full report, the Editor’s Note is below.

Carl Ostridge, Senior Vice President of Analytics Services at REsurety

Carl Ostridge
SVP of Analytics Services

Editor’s Note:

For Renewables, Timing is Everything

The final quarter of 2022 closed out with some extreme weather across most of the country and while lots of comparisons were quickly drawn against 2021’s Winter Storm Uri, December of 2022 also provided useful insights into the changing dynamics of power markets as renewable energy penetration rates increase. While the impact on market prices was smaller overall compared to Uri, one of the most interesting outcomes from the winter weather was present in ERCOT and highlighted the fact that timing is everything when it comes to capturing value from renewable energy assets.

The map in Figure 1 shows the “capture rate” potential of solar assets across the ERCOT footprint in December, 2022. Capture rate is the ratio of generation-weighted price and simple average price during the period in question and shows how much of the average price is ‘captured’ by, in this case, solar assets. Immediately visible is the interesting geographic trend across the ERCOT footprint, with the highest solar capture rates occurring in the east and west extremities while the lowest capture rates occur in the center. To understand what’s driving this, we need to look at the underlying data for one specific day.

Solar Capture Rate at ERCOT North Hub RT, December 2022
Figure 1: Solar Capture Rate at ERCOT North Hub RT, December 2022
Modeled Generation for 100MW Solar Assets Located in the Houston and Midland Regions & Market Prices, December 23rd, 2022
Figure 2: Modeled Generation for 100MW Solar Assets Located in the Houston and Midland Regions & Market Prices, December 23rd, 2022

Figure 2 shows the hourly average real-time market prices on December 23rd, 2022 as well as the generation of two hypothetical solar assets; one in west Texas and another close to the Houston area. The highest prices during this day occurred early in the morning and in the evening, meaning that most of the solar output during December 23rd did not coincide with the high prices. This leads to the very low overall capture rates in December, ranging from ~45-60% across ERCOT. But importantly, the lower prices during the day are not actually a coincidence – peak solar output has more than doubled since 2020 and there was approximately 8 GW of solar generation during the middle of the day on December 23rd, 2022, enough to move the grid out of scarcity pricing mode and back to more “normal” prices. This dynamic also creates values for locations with early sunrises (in the east) and late sunsets (in the west). The difference in sunrise and sunset times in Midland and Houston on December 23rd was approximately 30 minutes, but that was enough to secure an additional $50/MWh of value. Solar assets located close to Houston would have been able to capture the value of the high market prices before the sun came up on most of the existing solar assets further west and prices fell. That $50/MWh difference might not sound like a lot, but considering that solar capacity in ERCOT is predicted to exceed 20 GW by 2025, this type of ‘duck curve’ where solar generation serves to systematically reduce prices during the day is likely to happen with increasing frequency. Therefore, siting solar assets in locations able to naturally take advantage of the ramp hours may become increasingly valuable.

Finally, this shift in ERCOT’s grid mix, price dynamics, and subsequent drop in solar capture rates is predicted by REsurety’s Weather-Smart Fundamentals modeling. REsurety models ERCOT’s grid in 5 different future states, including high storage and net zero, and computes outcomes based on weather data representing the past 40+ years to derive the data in Figure 3 below.

ERCOT Solar Capture Rates Predicted by REsurety's Weather-Smart Modeling
Figure 3: ERCOT Solar Capture Rates Predicted by REsurety’s Weather-Smart Modeling

The average solar capture rate in ERCOT is forecast to drop below 100% by 2024, driven by the type of event we’re highlighting here – solar generation is high enough to reduce prices during the day and scarcity pricing is moved to the early morning and evening hours. As ever, timing will be the key to renewable energy value.

Q4 2022 Report Download

"*" indicates required fields

Name*
This field is for validation purposes and should be left unchanged.

Return to the blog post main menu.

Q3 2022 State of the Renewables Market Report

A view of Q3 2022 U.S. renewable energy performance

Q3 2022 State of the Renewables Market Report

REsurety creates the State of the Renewables Market report every quarter to provide readers with data-driven insight into the value and emerging trends of renewable generation in U.S. power markets. We use our domain expertise in power markets, atmospheric science, and renewable offtake to analyze thousands of locations and summarize key findings here. All of the data behind this analysis is curated by REsurety’s team of experts and available via our software products. It includes aggregated metrics for wind and solar projects operating in the U.S. All summaries are calculated using hourly-level data, and all energy-weighted price metrics are calculated using concurrent weather-driven generation and energy price time series. Please fill out the form at the bottom of the page to access the full report, the Editor’s Note is below.

Carl Ostridge, Editor of the Q3 2022 State of the Renewables Market Report

Carl Ostridge
SVP of Analytics Services

Editor’s Note:

Grid Congestion Hurts Project Economics & The Environment

Project developers know well the perils of transmission constraints and grid congestion when it comes to their project’s economics. If you locate your project at a point on the grid with limited availability to move clean electricity to where it will be consumed, local power prices will be much lower than average prices across the wider grid. This phenomenon is often referred to simply as “basis” but we’ll be more specific here and call it “price basis”. Price basis is bad for project economics for two reasons – first, the project’s merchant revenue (the value of electricity sold to the system operator at the point of interconnection) can be vastly reduced and second, if the project enters into a financial agreement to sell their electricity at a hub price (an aggregate across a large grid area) they may end up owing large sums of money that their merchant revenue cannot support.

The magnitude of price basis is hard to predict and, without investment in transmission or energy storage, tends to get worse over time as more wind and solar projects are added to the grid in locations with high resource availability. Developers and consultants spend lots of time, money and effort building models to analyze historical basis and forecast future scenarios to decide where to build projects and inform their economic outlook.

However, the transmission constraints and congestion that drive price basis also lead to what we’ll refer to as “emissions basis”. When a transmission constraint binds in a region with plentiful wind and solar generators, incremental clean energy (behind the constraint) often curtails other existing clean generators rather than carbon-emitting thermal generators elsewhere on the grid. This leads to emissions basis – wind and solar projects subject to transmission constraints avoid fewer tons of carbon emissions per MWh generated than the grid-wide average. In the absence of additional transmission or energy storage infrastructure, building additional wind and solar facilities in these regions has a diminishing environmental impact. Each new facility contributes less and less to the ultimate goal of decarbonization.

Figure 1: Price basis vs emissions basis for wind and solar projects in ERCOT and PJM (Jan-Jul 2022)

The strong correlation between price basis and emissions basis is highlighted in the plot below. Each point represents a wind or solar project in ERCOT or PJM and the values of price and emissions basis is calculated for the period January to July 2022. It’s clear from the plot that the projects with the highest levels of negative price basis have the lowest environmental impact while those with positive price basis tend to displace significantly more carbon emissions from the grid. Of course, there are many nuances to the data beyond this high-level correlation – trends based on location, technology, time of day and season – that REsurety’s Locational Marginal Emissions data can expose.

REsurety calculates Locational Marginal Emissions values at the nodal level with hourly resolution to provide the information necessary for project developers, investors, and offtakers to make informed decisions about where to build or invest in new projects to maximize their revenues and environmental impact.

We’ve expanded this report to provide information on both the financial and environmental value of wind and solar generation in the U.S. We hope you find this report informative.

Q3 2022 Report Download

"*" indicates required fields

Name*
This field is for validation purposes and should be left unchanged.

Return to the blog post main menu.

White Paper: Making It Count

Updating Scope 2 accounting to drive the next phase of decarbonization

Making it Count: Updating Scope 2 accounting to drive the next phase of decarbonization

EXCERPT: Corporations are increasingly focused on reducing their carbon footprints by decarbonizing the electric grid. While solar and wind energy development have rightly been a mainstay of these efforts, there is growing consensus that producing more clean energy alone isn’t enough. To maximize grid decarbonization, clean generation needs to occur at times and locations where its output displaces the highest-emitting resources. Consumption timing and location should be adjusted to minimize its carbon emissions via siting decisions, demand flexibility measures, and energy efficiency. And energy storage is needed to manage grid congestion and mismatches between clean supply and demand.

Effective carbon accounting frameworks can help coordinate these complex mitigation strategies by allocating emissions among the entities responsible for producing them. These accounting frameworks attempt to ensure that activities with more impact on actual emissions have more impact on carbon accounts. Given the large and increasing interest of investors, customers, regulators, and governments in corporate decarbonization initiatives, effective carbon accounting frameworks can encourage corporations to maximize their actual carbon reductions.

Fill out the form to access the full white paper.

"*" indicates required fields

Name*
This field is for validation purposes and should be left unchanged.

Return to the blog post main menu.

Q2 2022 REmap Report

Q2 2022 State of the Renewables Market report

REsurety creates the REmap-powered State of the Renewables Market report every quarter to provide readers with data-driven insight into the emerging trends and value of renewables in U.S. power markets. We combine our domain expertise in power markets, atmospheric science, and renewable offtake to analyze thousands of projects and locations and summarize key findings here. All of the data behind this analysis is available via our interactive software tool, REmap. Please fill out the form at the bottom of the page to access the full report, the Editor’s Note is below.

Blair Allen, Editor of the Q2 2022 State of the Renewables Market report

Blair Allen
Director, Software Customer Success, REsurety

Editor’s Note:

Node to hub basis* is rapidly becoming one of the most prominent financial risks for renewable developers and clean energy buyers alike. Although not a new issue, it has recently become more visible for two reasons: first, it is getting much worse in many areas with a lot of renewables, and second, clean energy buyers are increasingly taking on basis-risk exposure through contractual terms in PPA agreements. While basis used to be a risk only borne by project developers and investors, now corporates are sensitive to it as well.

In Q2, a handful of renewable-rich regions saw generation-weighted (AsGen) basis worsen by double digit values relative to the 4 year Q2 average. In many cases this was most prominent in areas that were already no stranger to negative basis. In ERCOT South Hub, for example, the average AsGen basis for operating wind projects in Q2 over the last 4 years was -$11 – in 2022 it declined to -$34. In the NP15 region of CAISO, the average AsGen basis for operating solar projects dropped from -$9 over the last 4 years to -$27 in 2022. And in SPP South Hub, operating wind projects saw their 4 year average decline from -$9 to -$31 in 2022.

But hub-level average values only tell part of the story, since basis is inherently a project-specific concern and can vary considerably not only within hub boundaries but across projects only miles apart from each other. For instance, when considering the projects within SPP South Hub last quarter, REmap shows project-by-project AsGen basis values that varied from as low as -$48 to as high as $26. The same extreme divergence played out across different ISOs and hubs, driven by subregional constraints driving a wedge in value between locations on either side of congested areas.

Basis warrants so much attention because it is extremely volatile and has a large impact on investment returns. In addition, it is hard to solve: investment into transmission infrastructure takes years and is extremely expensive. Developers screen for viable greenfield locations to avoid it, investors pore over model results to price it, and now energy buyers are turning to their advisors or tools to understand it better as well. The basis risk sharing clauses increasingly present in PPAs link the developer and clean energy buyer to the project’s basis performance in ways the two groups weren’t before, and the mechanics of that linkage aren’t always well understood. Although its impact ultimately depends
on the counterparty and the project-specific contract details that can either worsen or improve exposure, one thing is clear: basis should be on everyone’s radar.

In this Q2 REmap report, we analyze a number of metrics including: shape, capacity factor, and AsGen value of power for renewables domestically. REmap users have real-time access to these metrics and more, including basis analysis, through the map-based SaaS offering.

*AsGen basis is defined in this report as the difference between a project’s AsGen nodal price ($/MWh) and its hub price ($/MWh), where the hub is assumed to encompass the area where the node is located.

Q2 2022 REmap Report Download

"*" indicates required fields

Name*
This field is for validation purposes and should be left unchanged.

Return to the blog post main menu.

June 2022 Project Finance NewsWire

How Hedges Have Changed Since Uri, Lee Taylor, REsurety CEO

Project Finance NewsWire spotlights developments affecting project finance and the energy sector; you can find Lee Taylor’s feature on page 15.

AN EXCERPT:

Cover page of the June 2022 Project Finance NewsWire report.
A publication from Norton Rose Fulbright

The hedge market is offering the same menu of options a year and a half after a sudden cold snap in Texas left some power projects facing huge losses.

However, more attention is being paid to how to cap exposure in extreme scenarios.

Winter Storm Uri was an extreme cold event in late February 2021, centered in Texas but also affecting neighboring states, that was a one-in-10-year or one-in-50-year event, depending on which meteorologist you ask. It was not off the charts, but it involved an extreme level of sustained cold. There were deaths and significant property damage in Texas.

The storm led to a spike in electricity demand, especially for heating, and a shortfall in supply.

The shortfall in supply was driven by a number of factors, but the main driver was power plants froze physically and transmission infrastructure was shut down. These factors affected all types of power plants. The most pronounced effect was on gas-fired generation, but renewables, and wind in particular, were affected as well.

There was a pronounced financial impact in ERCOT because of the mechanism within ERCOT to reward generation during spikes in demand. There are administrative adders to the spot electricity price that force the price of power to go to a cap, incentivizing supply when demand spikes. At the time, the cap was $9,000 a megawatt hour. The result was that a spot market in which the price for electricity is often in the $20 to $40 range per MWh, was suddenly pricing power at $9,000 a MWh for three days.

Continue reading by downloading the PDF.

Q1 2022 REmap Report

REsurety creates the REmap-powered State of the Renewables Market report every quarter to provide readers with data-driven insight into the emerging trends and value of renewables in U.S. power markets. We combine our domain expertise in power markets, atmospheric science, and renewable offtake to analyze thousands of projects and locations and summarize key findings here. All of the data behind this analysis is available via our interactive software tool, REmap. Please fill out the form to access the full report, the Editor’s Note is below.

Q1 2022 State of the Renewables Market Report

"*" indicates required fields

Name*
This field is for validation purposes and should be left unchanged.

Blair Allen, Editor of the Q1 2022 State of the Renewables Market Report

Blair Allen
Director, Software Customer Success, REsurety

Editor’s Note: As the first quarter of 2022 concludes, we reflect on historic highs and historic lows. Another record in ERCOT marks the quarter’s passing, just as one did a year ago following the market events of February 2021. However, unlike the soaring prices of last year, this record involves a prolonged period of negative pricing, and another turn in a developing plotline we commented on last quarter. Please fill out the form below to access the report.

Consider this comparison: in February 2021 ERCOT West Hub (along with others) settled at the market price cap of $9,000/MWh for three days; in February 2022 ERCOT West Hub saw a two day period where prices never rose above $0/MWh. Mild demand coupled with sustained periods of high wind and solar generation created the conditions for this negative pricing event, though these conditions weren’t isolated to only those few days. In fact, by the end of the quarter, West Hub would more than double the number of negative-priced hours than were seen in Q1 the year prior.

One impact of this increasing frequency in negative pricing is rising levels of curtailment, particularly among solar projects which, unlike wind, don’t benefit from the production tax credit and are less likely to operate below $0/MWh. For example, using the modeled energy in REmap, which tells us how projects could have performed based on underlying wind/solar resource availability, last quarter West Texas solar projects saw anywhere from 20 to 30% of their potential hourly production for a given month fall in negatively priced hours. However, in reality these projects weren’t operating at their potential capacity in these intervals, and either shut down or significantly ramped down production.

Another important angle to consider: whereas for the last few years hourly negative prices at West Hub were evenly split between on-peak and off-peak hours during this time of year, this year saw that balance shift to 60/40 in favor of on-peak hours. The cause for this shift is clear: increasing amounts of solar capacity means that low pricing is no longer just following the production profiles for wind, and is coinciding more regularly with the rise and fall of solar energy.

Looking ahead, as seasons change into summer conditions so too do we expect a change in the volume of negative pricing. An increase and shift in demand– which will steadily move more towards the mid afternoon as air conditioning ramps–and a decline in wind production at the same time should converge to steadily mitigate on-peak negative price frequency. Q2 will likely be a transitional period, with frequency of negative pricing hours remaining high to start before subsiding more materially by the end of the quarter.

Return to the blog posts main menu.

REsurety Helps Akamai Power and Protect Life Online Sustainably

The most innovative companies worldwide choose Akamai to secure and deliver its digital experiences – helping billions of people live, work, and play every day. With the world’s largest and most trusted edge platform, Akamai keeps apps, code, and experiences closer to users – and threats farther away.

Akamai uses REsurety's Locational Marginal Emissions data to better calculate emission impacts.

With REsurety’s locational marginal emissions (LME) data, Akamai is able to be far more accurate in its avoided emissions calculations. Instead of trying to make sense of inconsistent regional datasets, Akamai is able to calculate the precise impact of its activities at each location on the grid. In addition, REsurety’s project LME reports provide visibility into why emissions are what they are – for example, showing how much gas or coal is being displaced, or how much wind is being curtailed due to Akamai’s activities. Lastly, Akamai is now able to use the LME data to evaluate new PPA opportunities to ensure that it is focusing its efforts on the locations and technologies that can have the biggest impact on carbon emissions. Learn more by downloading the case study.

“…LMEs bring the environmental community five steps closer to the measurement accuracy needed to solve the global emissions crisis.”

– Mike Mattera, Director of of Corporate Sustainability and ESG Officer, Akamai Technologies

Akamai Technologies' Mike Mattera

Return to the main menu of customer stories.

Return to the press release main menu.

Friends Don’t Let Friends Use 8760s …at least not for revenue modeling

Authored by Jennifer Newman, Vice President of Atmospheric Science Research, REsurety

White Paper Executive Summary

An “8760” (sometimes known as a “typical meteorological year,” or “TMY”) is a year-long hourly time series of expected generation for a wind or solar project. As the name implies, an 8760 contains generation values for all 8,760 hours of a year (non-leap year) and captures the typical seasonal and diurnal generation patterns at the site. Despite their widespread use in the renewable energy industry, there are two particular use cases of 8760s that can lead to significant errors in revenue estimation: 1) the pairing of an 8760 with a non-concurrent price time series and 2) the use of an 8760 as an input to a forward-looking price model.

The first, pairing an 8760 with non-concurrent prices, misses the impact of hourly wind and solar generation on market price, which can be particularly significant in markets with high renewable penetration. For example, Figure 1 demonstrates that pairing an 8760 with non-concurrent ERCOT power prices results in annual wind project revenue overestimates that can exceed 30%.

Graph showing the revenue estimation that can occur in renewable energy projects due to inefficient use of 8760s.

The second use case, using an 8760 generation profile as an input to a pricing model, does allow the user to capture the impact of hourly renewable generation on market price, if modeled correctly; however, the resulting distribution of forecasted prices will only represent the impact of a single, “normal” weather year. In reality, renewable energy projects will experience a variety of weather conditions, with non-typical weather years having an asymmetric and sometimes extreme impact on the price of power.

In this paper, we use observed and modeled data to quantify the impact of using an 8760 for renewable energy project value estimation, with a primary focus on wind generation. We demonstrate that pairing an 8760 with non-concurrent prices results in consistent wind project value overestimates in markets with significant wind penetration. We also show that using an 8760 to drive a forward-looking price model leads to a condensed price distribution that misses extremes and is not representative of historical price distributions.

Please fill out the form below to access the entire white paper.

Friends Don’t Let Friends Use 8760s

"*" indicates required fields

Name*
This field is for validation purposes and should be left unchanged.

REsurety Company Overview Brochure

Company Overview: Products, Capabilities and Experience

Download the REsurety Company Overview Brochure to learn about REsurety’s product and service offerings, who our clients are and what they’re saying, and how REsurety enables the industry’s decision makers to thrive through market intelligence, asset insight, and the tools for action.

REsurety Company Overview Brochure

Risk Management Brochure

Risk Management Tools for Clean Energy Sellers and Clean Energy Buyers

This brochure outlines: REsurety’s Experience; Tools for Energy Sellers including power purchase agreement, revenue swap, and balance of hedge; Tools for Clean Energy Buyers including settlement for guarantee agreement and volume firming agreement; and Settlement Index Options. Fill out the form below to download.

Risk Management Tools for Clean Energy Sellers and Clean Energy Buyers

"*" indicates required fields

Name*
This field is for validation purposes and should be left unchanged.

Platts Emissions Adjusted Renewable Energy Certificates (RECs) FAQ

S&P Global Commodity Insights Platts and REsurety Emissions Adjusted Renewable Energy Certificates (RECs) FAQ Brochure.

Platts has extensive coverage of the US Renewable Energy Certificates (RECs) market with prices published across all compliance and voluntary state markets.

Not all RECs have the same emissions impact and crucially emissions impact is not currently reported for any REC. As a result, the carbon reduction potential of individual REC instruments is not captured in current pricing.

S&P Global Commodity Insights has partnered with REsurety to bring transparency to renewables based emissions impacts.

Read the press release here.

Return to the brochures main menu.

REsurety Enables Broad Reach Power’s Grid Decarbonization

Broad Reach Power (BRP) is a leading U.S. utility-scale independent power producer (IPP) that understands the long-term value and rapid growth of energy storage as an infrastructure asset, particularly in those markets transitioning from traditional to renewable generation. BRP’s facilities provide flexibility, reliability, and environmental benefits while generating revenues from both risk-management contracts and spot-market opportunities.

Broad Reach Power explains how using locational marginal emissions affects their decision-making on renewable projects.

“With a storage pipeline exceeding 20GW, granular carbon emissions data is mission critical in assisting Broad Reach Power more efficiently reduce carbon emissions while increasing grid reliability; REsurety provides that data.”

– Paul Choi, EVP of Origination, Broad Reach Power

Learn how Broad Reach Power uses REsurety’s Locational Marginal Emissions (LMEs) to measure impact, offer innovative solutions and identify project locations.

REsurety enables Broad Reach Power's Grid Decarbonization with their locational marginal emissions (LME) tool.

Return to the main menu of customer stories.

Confidently Partner on Renewable Project Investments Using REsurety: HASI Case Study

HASI logo

We sat down with Rich Santoroski, Chief Risk Officer & Co-Head, Portfolio Management, and Raj Singamsetti, Market & Regulatory Lead of the climate investment firm HASI, to talk about how they use REsurety to conduct investments in renewable projects. 

With more than $8 billion in managed assets, HASI’s (NYSE: HASI) core purpose is to make climate positive investment with superior risk-adjusted returns. The company’s vision is that every investment should improve its climate future, which is why they require that all prospective investments are neutral to negative on incremental carbon emissions or have some other tangible environmental benefit, such as reducing water consumption.

HASI logo

We use REsurety in every deal because we trust it to help us to understand real world performance and to determine the appropriate value of an investment.” 

Rich Santoroski, EVP, Chief Risk Officer, & Co-Head – Portfolio Management, HASI

Learn how HASI uses REsurety’s Project Explorer

Confidently Partner on Renewable Project Investments Using REsurety: HASI Case Study

Note: What was historically known as REmap, is now referred to as two separate tiles in the REsurety platform, Project Explorer and Carbon Explorer.

Return to the main menu of customer stories.

Q4 2021 State of the Renewables Market Report

REmap Q4 2021 Report

REsurety creates the REmap-powered State of the Renewables Market report every quarter to provide readers with data-driven insight into the emerging trends and value of renewables in U.S. power markets. We combine our domain expertise in power markets, atmospheric science, and renewable offtake to analyze thousands of projects and locations and summarize key findings here. All of the data behind this analysis is available via our interactive software tool, REmap.

REmap Q4 2021 State of the Renewables Market Report

"*" indicates required fields

Name*
This field is for validation purposes and should be left unchanged.

Q3 2021 REmap Report

The REmap-Driven Q3 2021 State of Renewables Report was released today! This report reveals the captured value of operational wind and solar projects in major US markets in Q3 2021, and highlights how those values have changed in each market over time. Data is aggregated from millions of data points across public and private sources to shed light on the value of renewable generation.

We hope you appreciate the insight!

Cover of the REmap-powered State of the Renewables Market report for Q3 2021.

"*" indicates required fields

Name*
This field is for validation purposes and should be left unchanged.

Marathon Helps Clients Choose the Right Renewable Opportunities Using REsurety

REsurety sat down with Joan Hutchinson, Managing Director at Marathon Capital, to talk about how her team uses REsurety to inform their corporate clients on renewable energy procurement.

ABOUT MARATHON CAPITAL: Marathon Capital is a world-class investment bank with a mission to achieve their clients’ strategic and financial objectives by delivering inspired, knowledge-based solutions to the clean power, sustainable technologies & infrastructure markets. Marathon Capital is a leader in transformational deals across the global clean energy landscape bringing over 20 years of renewable energy and clean technology experience.

Cover of Marathon Helps Clients Choose the Right Renewable Opportunities Using REsurety

Note: What was historically known as REmap, is now referred to as two separate tiles in the REsurety platform, Project Explorer and Carbon Explorer.

Return to the main menu of customer stories.

Q2 2021 REmap Report

1. Modeled Q2 PPA Performance Across Major Hubs

REmap’s new vPPA simulator feature allows users to backcast vPPA settlement at all project locations, enabling analysis of market performance through the lens of a generator or vPPA buyer. 

vPPA settlements represent the value (or cost) of the unit-contingent contract-for-difference hedge settlements that result from a virtual Power Purchase Agreement (vPPA) with a project.

The results below show modeled¹ vPPA settlement values (in $/MWh) from the energy buyer’s perspective over the course of Q2. For potential vPPA buyers, this data answers the question: “If I signed a vPPA at prices available today, how would it have performed this past quarter?” 

Modeled vPPA settlement outside of ERCOT generally resulted in a cost for the vPPA buyer, even assuming today’s competitive PPA prices². Within ERCOT, vPPA settlement favored the vPPA buyer, with settlement values surpassing $25/MWh at some Texas solar projects. The cost of purchasing renewable energy through a vPPA was greatest for energy buyers with a wind vPPA settling at SPP North Hub, SPP South Hub, or PJM AEP-Dayton Hub. Solar vPPAs were most costly for projects settling at PJM Eastern Hub or MISO Michigan Hub.

Q2 2021 Modeled vPPA Settlement for Energy Buyers

Figure 1: Q2 2021 Modeled vPPA Settlement for Energy Buyers. Values for locations/technologies with limited data are not shown or marked "NA".
Figure 1: Q2 2021 Modeled vPPA Settlement for Energy Buyers. Values for locations/technologies with limited data are not shown or marked “NA”.

¹ Results use REmap data for operating projects, which includes modeled and observed hourly generation and observed market prices. Cell values represent the project with the maximum, minimum, or median project settlement value to an energy buyer for the quarter.

² vPPA prices used are from the LevelTen Q2 2021 PPA Price Index, which reports on PPA bids by hub and technology type.

2. Coastal Texas Wind Projects Join the Rest of the Pack

Coastal wind projects in Texas tend to experience higher wind speeds in the afternoon hours, which typically aligns well with afternoon periods of high demand and high power prices. The ability to generate during high priced afternoon hours means coastal projects typically benefit from a positive shape (also known as covariance), whereas wind projects in the rest of Texas tend to experience negative shape (i.e., hours of high generation are negatively correlated with hours of high power prices). 

However, in Q2 2021, coastal projects were not quite as fortunate. Shape profiles throughout all of ERCOT were quite negative, including coastal projects. Projects directly along the coast experienced shape discounts of $7-9/MWh, in line with other projects throughout the state. Figure 2a puts that in context of other ERCOT projects in Q2 2020 and 2021.

Q2 2021 Average Shape Values for Operating ERCOT Wind Projects

Figure 2a: Q2 2021 Average Shape Values for Operating ERCOT Wind Projects. The range and distribution of shape values for operating wind projects in ERCOT in Q2 2020 & 2021. The arrow indicates where the shape value of coastal wind projects fell. Source: REmap.

As an example: Stella Wind Farm, a coastal project in Kenedy County, experienced -$7.36/MWh average shape in Q2 2021, while its prior 5 year average for the same quarter was $0.66/MWh

Why did coastal Texas wind projects not do well relative to historical performance?

Continuing to use Stella Wind Farm as an example, we can review the hourly performance in REmap using the Hourly Data Explorer.
Figure 2b below shows the hourly data for Stella from April, a month in which the project’s shape value dropped to -$9.32/MWh. The top chart shows the hourly real-time hub price at ERCOT South and the bottom chart shows the hourly observed energy from Stella over the entire month.

April 2021 Hourly Hub Price and Generation Data

April 2021 Hourly Hub Price and Generation Data

Looking at Figure 2b, we can identify two periods of elevated prices, on April 11th and 13th, when prices spiked to over $1800/MWh.

Zooming into the relevant period in Figure 2c, we can see the hourly alignment between price and generation for those days. During both high price events, generation was fairly low.

Hourly Hub Price and Generation Data for April 11th and 13th

Hourly Hub Price and Generation Data for April 11th and 13th

3. Wide Basis Spreads for Wind Projects in Northern MISO

Last quarter, nodal prices for operating wind projects across North Dakota, Southwest Minnesota and Iowa continued a year-long trend of decline–with a precipitous drop. 

To use one project as an illustrative example, Emmoms-Logan Wind saw a -$17.30/MWh node-to-hub basis value in Q1 2021, which was among the lowest of any operating wind project in MISO that quarter. In Q2 2021, its node-to-hub basis plummeted to -$44.20/MWh³. 

If we use Emmoms-Logan’s Q1 performance as a benchmark and compare it to the Q2 performance for other operating wind projects in these states, the sharp decline in basis becomes more obvious. Figure 3a below shows operating wind projects in MISO. The color scale denotes historical node-to-hub basis value for Q2 2021, and the dark red areas denote any project that experienced an average basis value lower than -$17.30/MWh.

Q2 2021 Node-to-Hub Basis for Operating Wind Projects in MISO

Figure 3a: Q2 2021 Node-to-Hub Basis for Operating Wind Projects in MISO. Average generation-weighted basis values calculated using Minnesota Hub. Source: REmap.

Figure 3b below shows the 12-month trailing basis for a handful of wind projects in Northern MISO, including Emmons-Logan, and illustrates that this trend has been over a year in the making, but dramatically accelerated in the past 12 months.

12-Month Trailing Generation-Weighted Basis for Selected MISO Wind Projects

Figure 3b: 12-Month Trailing Generation-Weighted Basis for Selected MISO Wind Projects. Source: REmap.

Basis has been a known issue for project owners and operators and is increasingly a concern for vPPA buyers and offtakers who can be directly or indirectly impacted by basis depending on contract terms. Price data, provided by REmap, provides one critical piece of the puzzle. REmap’s generation data supplies the second critical piece, enabling users to see how much generation occurred in each hour and giving visibility into the impact of basis on project settlement.

³ Basis values are generation-weighted at the hourly level and use Minnesota Hub pricing. Generation is modeled. Actual results may differ.

White paper: Locational Marginal Emissions

White-Paper-Locational-Marginal-Emissions-Cover

A Force Multiplier for the Carbon Impact of Clean Energy Programs

Locational Marginal Emissions White Paper Cover

EXCERPT: While the impressive growth in clean energy development is an encouraging signal that we can tackle the harms of greenhouse gases and climate change, we should remember that clean energy deployment itself is not the ultimate goal. Tracking environmental goals in traditional units of MWh of clean energy is an outdated and imprecise approach that does not measure the carbon emissions reductions actually achieved. For example, clean resources in locations where high-emitting fossil plants cannot be retired for reliability reasons have high carbon abatement value, as do clean resources whose output aligns with times of high emissions intensity on the grid. Batteries and hybrid resources that can shape clean energy injection to maximize carbon abatement can also provide decarbonization benefits that are ignored by traditional MWh-based accounting.

There is a better way to measure and incentivize clean energy resources. We propose that customers, markets, and policymakers embrace the concept of Locational Marginal Emissions (LMEs) as a force multiplier for directing their clean energy program dollars to maximize carbon impact. In our 2-year analysis of renewable energy projects across Texas, we found that directing clean energy deployment to the highest-value renewable projects has the potential to double the carbon impact as compared to a more traditional annual energy matching approach. Setting goals and measuring performance using carbon-based metrics can help organizations select generation technologies, make siting decisions, and operate resources to minimize their carbon footprint.

Fill out the form to access the full white paper.

"*" indicates required fields

Name*
This field is for validation purposes and should be left unchanged.

Risk Mitigation for Corporate Renewable PPAs

Report-Risk-Mitigation-for-Corporate-Renewable-PPAs-Cover

REsurety contributes a chapter on how to manage risk in virtual PPAs through Volume Firming Agreements in this new report by RE-Source, a joint platform of WindEurope, SolarPower Europe, the RE100, and the World Business Council for Sustainable Development.

EXCERPT:

Corporates have a variety of different drivers for looking to source power from renewables, but the possibility to lower and fix electricity costs is a major part of the rationale for these deals. A recent survey of 1,200 companies across six countries showed that, of those sourcing renewables, 92% of them are doing so in order to reduce energy costs. Although decarbonization commitments often provide the initial driver to consider renewable corporate sourcing, the ability for a PPA to reduce energy cost volatility and generate savings on energy bills over the long term is cited by
most corporates as providing the main business case.

Fill out the form below to access the full presentation.

Cover of Risk Mitigation for Corporate Renewable PPAs report

"*" indicates required fields

Name*
This field is for validation purposes and should be left unchanged.

Return to the resources main menu.

Accounting Primer for C&I Renewable Energy Buyers

Report-Accounting-Primer-for-CI-Renewable-Energy-Buyers

For C&I Buyers looking to mitigate risks in their PPAs, CohnReznick provides new accounting guidance on Volume Firming Agreements and Settlement Guarantee Agreements in a whitepaper co-published with REsurety.

EXCERPT

An important consideration for Buyers is how these contracts, or group of contracts, will be assessed for accounting purposes. Like a traditional vPPA, contracts like the SGA and VFA can require complex accounting analysis. The application of the appropriate financial accounting requires not only a clear understanding of the nature of the transaction and the rights and obligations of the parties to such agreements, but also the ability to appropriately navigate through the various Topics, Subtopics, Sections, and Subsections of the Financial Accounting Standards Board’s Accounting Standards Codification (“ASC”).

Fill out the form below to access the full report.

Accounting Primer for C&I Renewable Energy Buyers

"*" indicates required fields

Name*
This field is for validation purposes and should be left unchanged.

Return to the resources main menu.

A Corporate Purchaser’s Guide to Risk Mitigation

Report-A-Corporate-Purchasers-Guide-to-Risk-Mitigation-Cover

REsurety’s CEO Lee Taylor offered insight into this new report by The Business Renewables Center (BRC), a program of Rocky Mountain Institute.

EXCERPT

The US corporate renewable market has grown by leaps and bounds in the past five years. Corporate procurement has rapidly expanded from a niche to a substantial part of the US electricity system—one that has cumulatively brought online over 12% of all utility scale wind and solar installed in the country today. However, risk mitigation solutions have not kept pace with a rapidly diversifying and expanding corporate market. The issue of buyer risk has been raised with increasing frequency over the last few years and the market must address this issue seriously and immediately. For its own long-term health, the market must move away from the current one-size-fits-all approach to a “many-sizes-for-all” approach to risk mitigation.

Fill out the form below to access the report.

A Corporate Purchasers Guide to Risk Mitigation Cover

"*" indicates required fields

Name*
This field is for validation purposes and should be left unchanged.

Return to the main menu of resources.