February 7, 2023
A view of Q4 2022 U.S. renewable energy performance

REsurety creates the State of the Renewables Market report every quarter to provide readers with data-driven insight into the value and emerging trends of renewable generation in U.S. power markets. We use our domain expertise in power markets, atmospheric science, and renewable offtake to analyze thousands of locations and summarize key findings here. All of the data behind this analysis is curated by REsurety’s team of experts and available via our software products. It includes aggregated metrics for wind and solar projects operating in the U.S. All summaries are calculated using hourly-level data, and all energy-weighted price metrics are calculated using concurrent weather-driven generation and energy price time series. Please fill out the form at the bottom of the page to access the full report, the Editor’s Note is below.

Carl Ostridge
SVP of Analytics Services
Editor’s Note:
For Renewables, Timing is Everything
The final quarter of 2022 closed out with some extreme weather across most of the country and while lots of comparisons were quickly drawn against 2021’s Winter Storm Uri, December of 2022 also provided useful insights into the changing dynamics of power markets as renewable energy penetration rates increase. While the impact on market prices was smaller overall compared to Uri, one of the most interesting outcomes from the winter weather was present in ERCOT and highlighted the fact that timing is everything when it comes to capturing value from renewable energy assets.
The map in Figure 1 shows the “capture rate” potential of solar assets across the ERCOT footprint in December, 2022. Capture rate is the ratio of generation-weighted price and simple average price during the period in question and shows how much of the average price is ‘captured’ by, in this case, solar assets. Immediately visible is the interesting geographic trend across the ERCOT footprint, with the highest solar capture rates occurring in the east and west extremities while the lowest capture rates occur in the center. To understand what’s driving this, we need to look at the underlying data for one specific day.
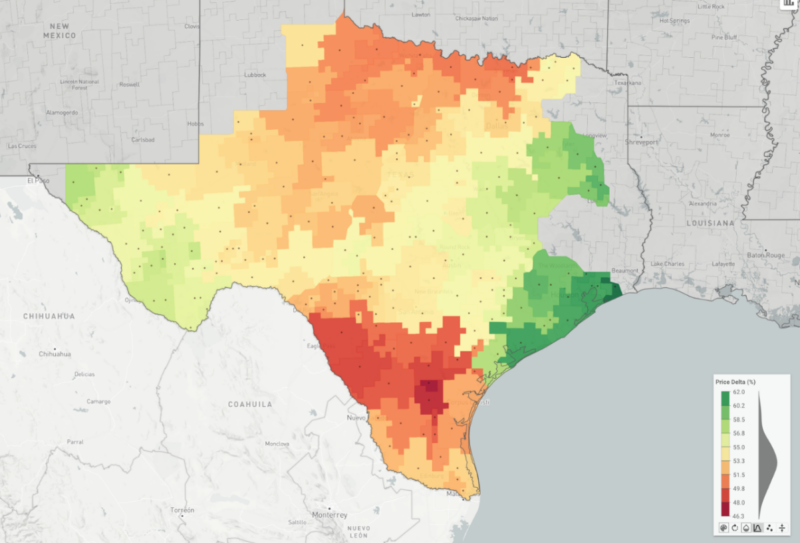
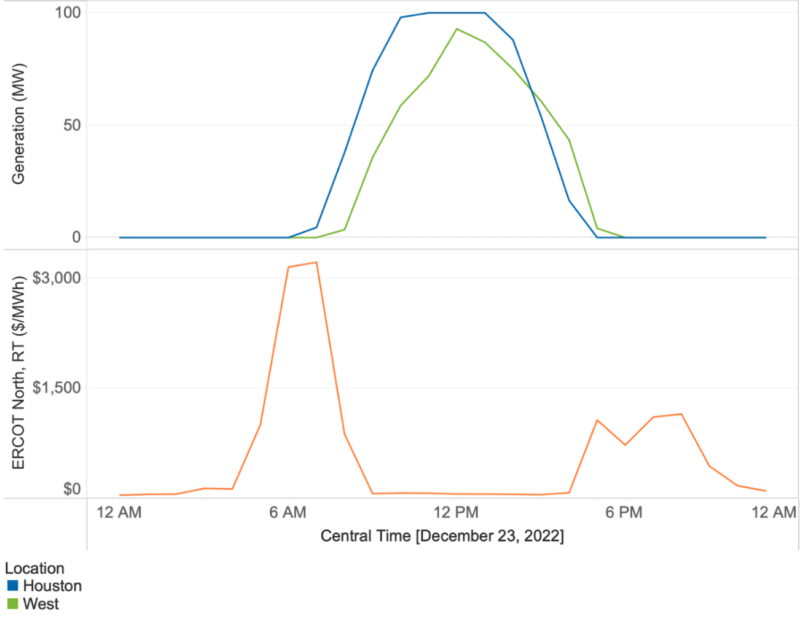
Figure 2 shows the hourly average real-time market prices on December 23rd, 2022 as well as the generation of two hypothetical solar assets; one in west Texas and another close to the Houston area. The highest prices during this day occurred early in the morning and in the evening, meaning that most of the solar output during December 23rd did not coincide with the high prices. This leads to the very low overall capture rates in December, ranging from ~45-60% across ERCOT. But importantly, the lower prices during the day are not actually a coincidence – peak solar output has more than doubled since 2020 and there was approximately 8 GW of solar generation during the middle of the day on December 23rd, 2022, enough to move the grid out of scarcity pricing mode and back to more “normal” prices. This dynamic also creates values for locations with early sunrises (in the east) and late sunsets (in the west). The difference in sunrise and sunset times in Midland and Houston on December 23rd was approximately 30 minutes, but that was enough to secure an additional $50/MWh of value. Solar assets located close to Houston would have been able to capture the value of the high market prices before the sun came up on most of the existing solar assets further west and prices fell. That $50/MWh difference might not sound like a lot, but considering that solar capacity in ERCOT is predicted to exceed 20 GW by 2025, this type of ‘duck curve’ where solar generation serves to systematically reduce prices during the day is likely to happen with increasing frequency. Therefore, siting solar assets in locations able to naturally take advantage of the ramp hours may become increasingly valuable.
Finally, this shift in ERCOT’s grid mix, price dynamics, and subsequent drop in solar capture rates is predicted by REsurety’s Weather-Smart Fundamentals modeling. REsurety models ERCOT’s grid in 5 different future states, including high storage and net zero, and computes outcomes based on weather data representing the past 40+ years to derive the data in Figure 3 below.
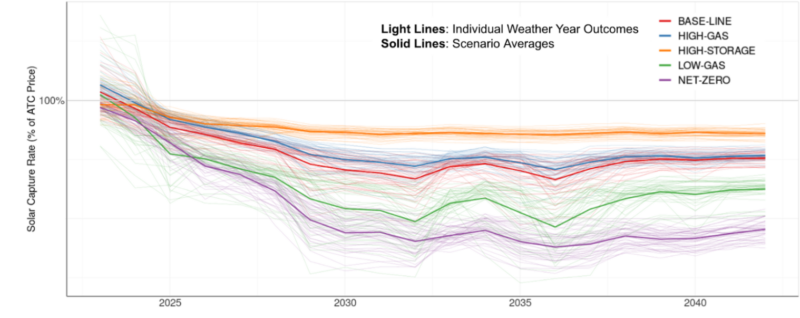
The average solar capture rate in ERCOT is forecast to drop below 100% by 2024, driven by the type of event we’re highlighting here – solar generation is high enough to reduce prices during the day and scarcity pricing is moved to the early morning and evening hours. As ever, timing will be the key to renewable energy value.
Q4 2022 Report Download
"*" indicates required fields
Return to the blog post main menu.