May 8, 2023
A view of Q1 2023 U.S. renewable energy performance
REsurety creates the State of the Renewables Market report every quarter to provide readers with data-driven insight into the value and emerging trends of renewable generation in U.S. power markets. We use our domain expertise in power markets, atmospheric science, and renewable offtake to analyze thousands of locations and summarize key findings here. All of the data behind this analysis is curated by REsurety’s team of experts and available via our software products. It includes aggregated metrics for wind and solar projects operating in the U.S. All summaries are calculated using hourly-level data, and all energy-weighted price metrics are calculated using concurrent weather-driven generation and energy price time series. Please fill out the form at the bottom of the page to access the full report, the Editor’s Note is below.

Lead Analyst
Senior Analyst, Analytics Services – Pre-Trade Services

Editor
SVP of Analytics Services
Editor’s Note:
Ups and Downs on the Power Market Rollercoaster
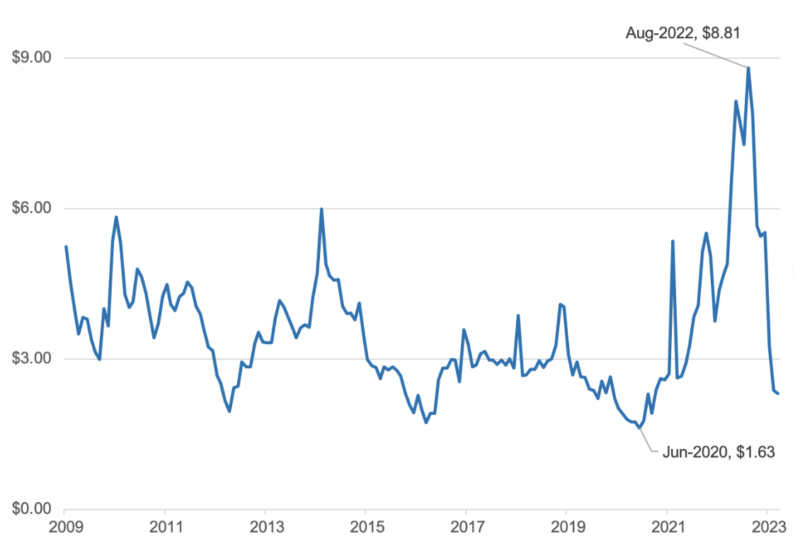
For me, the story of 2022 was the high average power prices across the U.S. Emphasis on average because the high prices were not driven by individual large weather or market events like Winter Storm Uri in 2021. Yes, there were some weather-linked events, but these really didn’t move the needle at the annual level. The real driver in 2022 was the underlying price of natural gas – Henry Hub prices started the year at ~$4/MMBtu (already high compared to the last few years) and peaked close to $9/MMBtu in the summer. That’s by far the highest natural gas price seen in the post-shale era of the last 14 or so years.
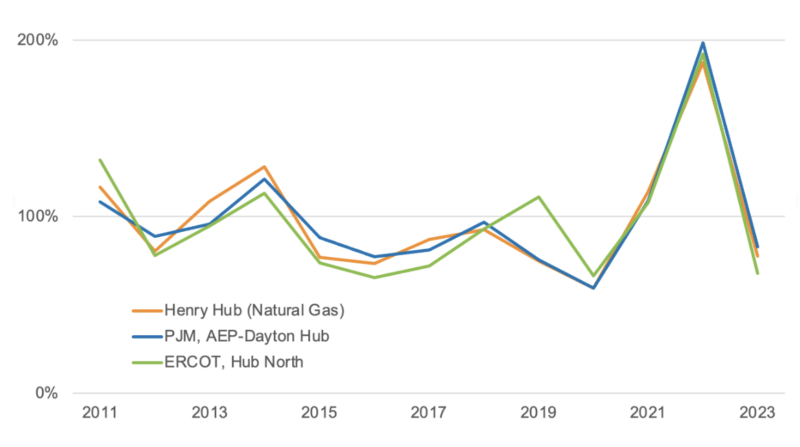
Natural gas is often the marginal fuel in many regions and there’s a strong correlation between natural gas prices and power prices as shown in Figure 2. The historic natural gas prices during 2022 also resulted in power prices reaching their highest annual average in at least the last decade (Winter Storm Uri’s influence in February 2021 excluded).
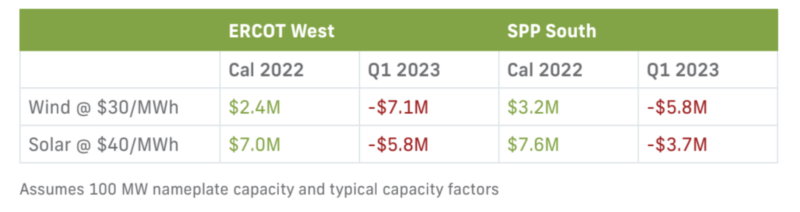
Those high prices led to large payouts to merchant projects and clean energy buyers. For example, a typical 100 MW wind project with a $30/MWh PPA settling at ERCOT West would’ve paid more than $2M to their buyer by the end of the year. An equivalent vPPA settling at SPP South would’ve paid out more than $3M.
Now, fast forward to Q1 2023 and the world looks very different. Gas prices have dropped more than 50% compared to Q4 2022 and 40% compared to Q1 2022. Power prices in most markets have seen similar decreases, down 20-50% compared to Q1 of last year. That means the same vPPAs that were paying large sums to buyers throughout 2022 are now back to paying the projects. In some cases, buyers cut checks to projects in Q1 that exceeded the checks that they received during the whole of 2022.
The volatility seen in commodity and power markets in the past 18 months is expected to continue. Natural gas fundamentals, new generation interconnection, supply chain challenges, geopolitical turmoil, and increasingly extreme weather are expected to continue causing large ups and downs in the markets and that, of course, means ups and downs for those buying and selling power.
To understand the contributions of the three primary drivers of changing prices and volatility – grid composition, commodity prices, and weather – REsurety publishes Weather-Smart fundamentals power price forecasts each quarter. For the next 20 years the forecasts account for multiple commodity scenarios and for each of those scenarios models how the grid and market will reach under weather conditions representing each of the past 40 years. For example, we forecast this summer’s prices under ‘mid’, ‘low’, and ‘high’ gas scenarios and if the heat of 2011 or the relatively mild weather of 2007 was repeated (and every set of summer conditions in between). This provides a unique view of how both the commodity prices and weather drive market outcomes.
The model predicts there’s approximately a 3x range between the highest and lowest prices averaged for the remainder of 2023. That’s the difference between having a vPPA pay out to the buyer at similar levels to 2022 or continue to pay out to the project in line with Q1 of this year. With this level of volatility, the clichéd investment disclaimers certainly ring true – “past performance is not a guarantee of future performance and prices may go up as well as down.”
At REsurety we’ll be keeping a close eye on how both the commodity markets and weather unfold over the coming months and keeping our Weather-Smart forecasts up to date with the latest data.
Q1 2023 Report Download
"*" indicates required fields
Return to the blog post main menu.