November 10, 2022
A view of Q3 2022 U.S. renewable energy performance
REsurety creates the State of the Renewables Market report every quarter to provide readers with data-driven insight into the value and emerging trends of renewable generation in U.S. power markets. We use our domain expertise in power markets, atmospheric science, and renewable offtake to analyze thousands of locations and summarize key findings here. All of the data behind this analysis is curated by REsurety’s team of experts and available via our software products. It includes aggregated metrics for wind and solar projects operating in the U.S. All summaries are calculated using hourly-level data, and all energy-weighted price metrics are calculated using concurrent weather-driven generation and energy price time series. Please fill out the form at the bottom of the page to access the full report, the Editor’s Note is below.

Carl Ostridge
SVP of Analytics Services
Editor’s Note:
Grid Congestion Hurts Project Economics & The Environment
Project developers know well the perils of transmission constraints and grid congestion when it comes to their project’s economics. If you locate your project at a point on the grid with limited availability to move clean electricity to where it will be consumed, local power prices will be much lower than average prices across the wider grid. This phenomenon is often referred to simply as “basis” but we’ll be more specific here and call it “price basis”. Price basis is bad for project economics for two reasons – first, the project’s merchant revenue (the value of electricity sold to the system operator at the point of interconnection) can be vastly reduced and second, if the project enters into a financial agreement to sell their electricity at a hub price (an aggregate across a large grid area) they may end up owing large sums of money that their merchant revenue cannot support.
The magnitude of price basis is hard to predict and, without investment in transmission or energy storage, tends to get worse over time as more wind and solar projects are added to the grid in locations with high resource availability. Developers and consultants spend lots of time, money and effort building models to analyze historical basis and forecast future scenarios to decide where to build projects and inform their economic outlook.
However, the transmission constraints and congestion that drive price basis also lead to what we’ll refer to as “emissions basis”. When a transmission constraint binds in a region with plentiful wind and solar generators, incremental clean energy (behind the constraint) often curtails other existing clean generators rather than carbon-emitting thermal generators elsewhere on the grid. This leads to emissions basis – wind and solar projects subject to transmission constraints avoid fewer tons of carbon emissions per MWh generated than the grid-wide average. In the absence of additional transmission or energy storage infrastructure, building additional wind and solar facilities in these regions has a diminishing environmental impact. Each new facility contributes less and less to the ultimate goal of decarbonization.
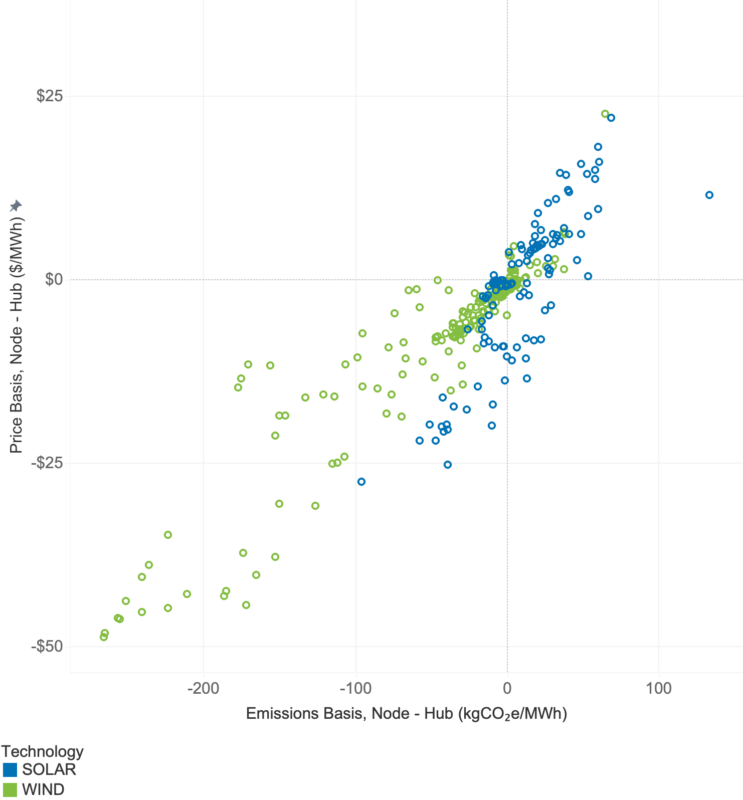
The strong correlation between price basis and emissions basis is highlighted in the plot below. Each point represents a wind or solar project in ERCOT or PJM and the values of price and emissions basis is calculated for the period January to July 2022. It’s clear from the plot that the projects with the highest levels of negative price basis have the lowest environmental impact while those with positive price basis tend to displace significantly more carbon emissions from the grid. Of course, there are many nuances to the data beyond this high-level correlation – trends based on location, technology, time of day and season – that REsurety’s Locational Marginal Emissions data can expose.
REsurety calculates Locational Marginal Emissions values at the nodal level with hourly resolution to provide the information necessary for project developers, investors, and offtakers to make informed decisions about where to build or invest in new projects to maximize their revenues and environmental impact.
We’ve expanded this report to provide information on both the financial and environmental value of wind and solar generation in the U.S. We hope you find this report informative.
Q3 2022 Report Download
"*" indicates required fields
Return to the blog post main menu.