Tag: REmap

Carbon Emissions Data is Now Available in REmap

Blair Allen, author of Carbon Emissions Data is Now Available in REmap
Author: Blair Allen
Director, Customer Success

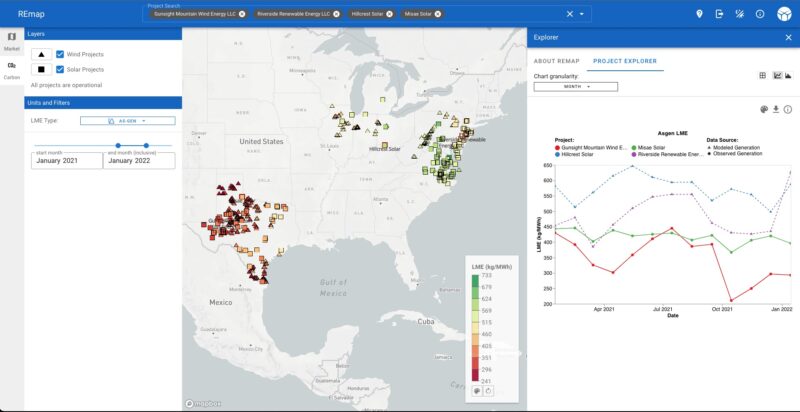
Today we’re announcing the availability of Locational Marginal Emissions (LMEs) data in REmap. With this launch, our customers can now analyze the market value of their renewable energy projects as well as the carbon impact, all in one platform.

When we spoke with clean energy buyers, investors, and advisors about their biggest challenges, we learned that they need a better way to co-optimize the economic and carbon emissions impacts of their investment or procurement decisions. The economics of renewable energy projects have long been driven by time and location: when and where each MWh is produced determines the market value of that generation. As carbon accounting evolves to be similarly granular, customers want a toolset to help evaluate emissions impacts with the same level of rigor.

REsurety’s Renewable Energy Market Analytics Platform (REmap) is a map-based web platform that allows users to visualize and access hourly generation and power market data across thousands of locations in U.S. markets. For the past several years it has been valued by customers for its speed, ease of use, and high-quality datasets. REsurety’s nodal LME data, which measures the carbon emissions impact of clean energy generation at each specific location and hour, previously existed as a standalone data solution. We’re excited to integrate LME data into REmap to provide customers with fast and easy access to LME data via the powerful web interface, and enhance the capabilities of the REmap platform.

Analyze emissions performance in the same manner you’re accustomed to for market performance. Compare the emissions of projects across or within ISOs at the hourly or monthly level.

What this means to customers:

For clean energy buyers: access to LME data in REmap is particularly valuable when developing a procurement strategy or analyzing request for proposal (RFP) submissions for a power purchase agreement (PPA). It identifies the projects with the greatest decarbonization potential or determines which ISOs or regions to prioritize based on potential emissions impact.

For climate positive investors: the ability to see the emissions impact of merger and acquisition (M&A) opportunities alongside project financial performance; enabling accurate analysis of avoided emissions per dollar invested.

For investment banks and corporate advisors: the capability to clearly visualize the emissions and power market data needed to win clients and help set and execute sustainability strategies.

Learn more at http://resurety.com/remap or contact [email protected].

About the author

Blair Allen has extensive experience in energy information services products that support both ends of energy market exposure, from the project development phase to managing merchant generation. Before joining REsurety, Mr. Allen worked at a large energy data and analytics company as the Chief of Staff to their Power business unit, helping to manage, develop, and grow the company’s global portfolio of electricity market products and services. Prior to that he worked as a Senior Market Analyst offering price and congestion forecasts to customers with physical or financial risk in Mid-continent ISO. At REsurety, Blair serves as the Director of Customer Success.

Blair holds a Bachelor’s degree in Philosophy from Bucknell University, with a minor in Economics.

Return to the blog post main menu.

Weather-Smart Fundamentals Modeling Gives More Meaningful Power Price Forecasts

Jessica Tomaszewski, author of Weather-Smart Fundamentals Modeling Gives More Meaningful Power Price Forecasts
Author: Jessica Tomaszewski
Senior Research Scientist

Forecasting of power prices is a part of everyday life for the renewables industry. Accurate power price forecasts are necessary to support the green energy transition by empowering investment, procurement, and financial-planning workflows of buyers, sellers, and investors of clean energy.

There are two primary types of models used to forecast power prices: Statistical Models and Fundamentals Models. Statistical models learn relationships between prices and other variables based on previously observed outcomes and apply these relationships to make predictions about the real world. Such models are useful in short-term, high-frequency workflows like near-term trading, where market behavior is not expected to deviate significantly from recent history. However, statistical models struggle in longer-term applications where evolving grid mixes, generation technologies, and market designs mean that the future will look different than the past. Fundamentals models can capture the impact of these changes, which is key for making long-term predictions of power prices.

Fundamentals models offer users the benefits of extendability, flexibility, and transparency in their predictions. However, the heavy computational burden of these models has traditionally required price forecasters to make simplifying assumptions about the weather. Much of the industry uses a “Weather-Normal” or “Typical Meteorological Year” to represent forward-looking weather conditions in their price models. But “atypical” meteorological conditions like heat waves, cold snaps, and severe storms can all cause dramatic surges in electricity demand, alter wind and solar supply, and affect prices. A price model that only uses a typical meteorological year will miss the extreme prices that come with extreme weather, resulting in a dramatically different modeled outcome from the true range of expected possibilities.

REsurety has taken a different, Weather-Smart approach: Our price model captures the hourly signal of 40 representative weather years in a computationally efficient way, unlocking several key benefits to customers of our fundamentals-based price models.

Key Benefits of Weather Variability in Price Models

A More Representative Mean

Weather variability is an important driver of the economics of any type of clean energy project, but storage is particularly sensitive to atypical weather conditions. For storage projects engaging in energy arbitrage, profitability relies on buying energy when prices are low and discharging it when prices are high. Energy arbitrage becomes more lucrative as the spread between high and low prices increases. Forecasting price using a weather-normal year results in inaccurate forecasts of storage value because it misses the extremes of price that drive value for storage resources. Simply put, weather-normal modeling materially undervalues the energy arbitrage revenue opportunity of storage projects.

When adequate weather variability is represented in a price model, the predicted mean value of a storage project will better reflect these high price events, as illustrated in the schematic below. Two cases are considered. The blue line represents the case with a distribution of daily forecasted storage project values created using prices produced by a Weather-Smart model fed with the signal of 40 weather years. The second case represents in green the distribution of daily storage values based on prices produced by modeling a single weather-normal year of data. While both distributions of storage project value report a similar median, the Weather-Smart distribution produces a mean value that is significantly higher than its median. In this case, the mean can serve as a simple, single quantity that distills the potential profitability of a storage project in a way that acknowledges the extreme events contributing to its value.

The benefit of Weather-Smart distributions: Including adequate weather variability produces a mean value that acknowledges extreme weather and price events.

Visibility into Range

REsurety’s fundamentals price model gives users unique insight into their price forecasts, and by modeling hourly weather variability representative of 40 years, we elevate this insight to give visibility into a broad range of outcomes. For example, a forecast driven by a weather-normal year of input data will give a forecasted wind capture rate for a typical summer, perhaps at 80%. But how can a clean energy buyer set expectations with their financial planning team in the event of a warmer-than-average summer with lower-than-average wind speeds that yields a capture rate of only 60%? A wide distribution of potential outcomes exists depending on the weather conditions, and visibility into this range of outcomes is important for making financial decisions and planning for downside scenarios. This approach is outlined in greater depth in another REsurety blog post.

Better-Informed Portfolio Optimization

Visibility into range provided by Weather-Smart price forecasts lends itself to better portfolio optimization as well. Portfolio risk mitigation is possible through understanding the tails of distributions of individual assets, which price models with awareness of adequate weather variability can provide. By optimizing portfolios to include assets that provide value in countering scenarios, the overall portfolio risk can be narrowed. For example, a forecasted summer month that has low wind speeds and high temperatures will likely be profitable for solar projects, which can help offset low wind value or Fixed Volume Swap losses. A Weather-Smart price model that is aware of such anomalous weather conditions allows for this kind of portfolio optimization.

About the author
Jessica Tomaszewski is an atmospheric scientist with experience in boundary layer meteorology, numerical weather prediction, and wind resource assessment. Prior to joining REsurety, Jessica completed a National Science Foundation Graduate Research Fellowship with a focus on simulating interactions between wind farms and the lower atmosphere, as well as two summer internships at NextEra Analytics investigating improvements to the wind farm wake modeling process. As a research scientist at REsurety, she builds and investigates new techniques for analyzing renewable resources and mitigating their financial risk.

Jessica holds a PhD and Master’s degree in Atmospheric and Oceanic Sciences from the University of Colorado. She also holds a Bachelor’s degree in Meteorology from the University of Oklahoma. Learn more about Jessica here.

Return to the blog post main menu.

REsurety’s Weather-Smart Fundamentals Power Price Forecasts are Now Available

Solar Wind Energy
Adam Reeve, author of REsurety's Weather-Smart Fundamentals Power Price Forecasts are Now Available
Adam Reeve
SVP of Software Solutions

Here at REsurety, we know how important accurate forecasting is. We know that our customers need credible, explainable predictions of the expected value and upside/downside risks of the value of clean energy in order to make long-term investment or procurement decisions. And for that reason, for the better part of the last ten years, our team has been developing and improving upon long-term power price and renewable generation forecasting models. Up until now, however, those forecasts have relied on machine-learning methods and have only been available on a limited basis to customers via our Advisory services. We’re excited to announce that as of today, we have released a new fundamentals forecasting model, and are making it available across all of our product and service offerings including our SaaS platform, REmap.

REsurety developed our latest fundamentals forecasts in order to give our customers unprecedented ease of access and confidence about the future value of their clean energy projects. With these newly released forecasts, you can:

  • Develop an optimal portfolio: simulate portfolio performance under a range of outcomes to develop/manage your portfolio.
  • Calculate project-specific forecasts: all of our forecasts are natively calculated using project-specific hourly generation, so you can calculate the expected performance of your project with one click in REmap.
  • Stress test: gain visibility into downside risk driven by weather variability or changes in market dynamics, e.g. increased storage penetration, a hot summer/winter, or the impact of high renewables build out.

The Importance of Weather Variability

The most distinguishing characteristic of REsurety’s forecasts is that we don’t just model a single weather-normal year (e.g., an 8760), because we know that models based on 8760s will likely overestimate value for renewables, underestimate value for storage, and underestimate variability across all projects. Instead, we simulate ~40 years of representative hourly weather – and the impact that has on every project and load center on the grid – to develop a thorough distribution of possible weather outcomes. Importantly, this means that hourly project-specific generation is an input into our model, as opposed to being calculated after the fact.

This extremely data-intensive and compute-hungry approach is designed to give customers the answers that they need about the future. Users can: run sophisticated portfolio simulations across projects and markets using realistic and consistent weather inputs; confidently calculate the value of storage, where profitability is highest during periods of extreme weather and market volatility; and calculate the expected value and downside risk in their PPAs for accurate budgeting.

Unlike traditional forecast providers, REsurety’s fundamentals-based forecasts realistically take into account a range of possible weather conditions and the impact that they have on each project in order to solve for power prices in each hour. The plot below shows the value of the approach: for each of the five market scenarios, 40 representative weather-years (represented by thin lines) are simulated in the model. We’re calling this realistic approach to weather variability “Weather-Smart.”

The value of full weather distributions: weather and various market scenarios drive variability in the capture rate for solar generators.

“We’re excited to bring together our strengths in Atmospheric Science and Power Market Analytics in this model release,” said Adam Reeve, SVP of Software Solutions at REsurety. “Traditionally, those two fields have been separate in the industry, limiting the ability for customers to apply forecasts to their clean energy projects or portfolios. This Weather-Smart approach gives users a much more robust way of forecasting the value of clean energy.”

Why A Fundamentals Model?

REsurety’s newest forecasts leverage an hourly production cost model that accurately represents the operational and market design complexities of the power markets. It takes into account the physical power flows, hourly generation from each renewable plant, hourly load, and future market conditions inputs to solve for hourly power prices. As an example, this means that, in each hour, we model the generation at every renewable plant on the grid (based on localized wind speeds / solar irradiance, turbine / panel type, etc.) as well as production costs for dispatchable generators. We also model load in each hour, as well as the transmission limitations of the grid and other market-specific characteristics. Given these inputs and constraints, we then solve for power prices in the same way that a system operator (such as ERCOT) would.

After years of creating advanced models, we’ve learned that such a rigorous approach has a number of advantages over machine-learning (ML) models. Specifically, ML models struggle to make accurate predictions about a future that may look very different from the recorded history – such as predicting price formation in a market with a rapidly changing installed base of grid-scale storage. Results from ML models are less interpretable, making it harder for customers to understand why a certain price was produced – and by extension whether it is reasonable or not. Lastly, ML approaches are less capable of accurately simulating how changes to market rules or regulatory policies will impact prices. For these reasons, REsurety has invested in the latest fundamentals-based model that we’re excited to release today.

REsurety’s Weather-Smart fundamentals power price forecasts are currently available in ERCOT, with CAISO available later this year and full market coverage by mid 2023.

To learn more, please visit http://resurety.com/remap or email [email protected].

Return to the blog post main menu.

The Importance of Basis in Project Valuations: How Investors are Using REmap to Help

Wind Energy

Authored by Blair Allen, Director, Software Customer Success

Blair Allen, author of The Importance of Basis in Project Valuations: How Investors are Using REmap to Help

In our Q2 2022 REmap report, we focused on node-to-hub basis: how deteriorating node-to-hub basis and the increase in use of basis-sharing clauses in PPAs were forcing companies to direct more attention to it as a risk, and that investors were chief among that group because of its impact on project health and ultimately project returns. This has prompted investors to search for new tools to better understand the basis risk faced by existing assets, and to carry that focus up the decision-making tree when new investment decisions are being made. Simply put, basis exposure not only impacts the valuation for cash and tax equity investors, but increasingly whether to walk away and forgo the time and cost of additional due diligence of a project. To help drive towards more efficient and realistic investment decisions, investors are turning to alternative data sources to supplement their traditional methods.

One way that REmap, REsurety’s SaaS-based market analytics product, supports more efficient and realistic project valuations is by saving investors time when accessing up-to-date historical basis performance for wind and solar projects. REmap shows hourly basis values for all operational wind and solar projects across the country. Investors use this data as a confidence check against forecasted basis values present in sponsor models, and to see how it aligns with historical performance at that proxy node as well as nearby nodes. Investors are turning to REmap for this information not only because it is easy to access and visualize with just a few clicks, but also because REmap’s hourly generation for all projects enables users to see the generation-weighted impact of basis – which is ultimately what matters most for project valuations.

Caddo County and neighboring wind projects

For example, an investor might be evaluating a portfolio of assets with a mix of operating and in-development projects. One project is an in-development wind farm in Caddo County, Oklahoma, and the engineering report included in the sponsor model designated a nearby operating wind project as the representative “proxy” node due to its geographical and electrical proximity to the new location. The sponsor model says the forecasted basis for the project is going to be $3 over the next few years then fall to $1 in the outer years. To confidence check this value, the investor can login to REmap and search for the county to identify the proxy node used in the consulting report, then quickly flip through the time series data for the proxy node to see how it performed recently, how prices have trended, and the project’s generation-weighted value. The same is then done for neighboring nodes/projects to see if the proxy node is an outlier or consistent with trends in the area. If performance at other nearby nodes differs, a note is made to discuss this difference with the sponsor or consultants to understand why any differences may exist. In this example, the investor finds that, historically, generation-weighted basis has ranged anywhere from $2 to -$12 on average for the proxy node and neighboring nodes, and recent data suggests a downward trend at several locations. The decision is made to use several different basis scalar values in the project model, based on historical performance at these different locations, so that the investor can evaluate how these different scenarios may impact expected profits and the likelihood of hitting a return threshold. After discussing with internal stakeholders, a decision will be made on how to price the overall investment given the risks inherent in this project, or to pass on the investment opportunity.

The historical, monthly-level generation-weighted basis for wind projects in, and neighboring, Caddo County. Projects display a range in month-to-month performance, and a mix of trends.

Investors know that markets are changing and history isn’t necessarily an indication of future performance, and that costly 3rd-party basis forecasts don’t get it right either. The utility of historical data is that it represents real-world performance and builds a foundation for evaluating the uncertainty in the future. Investors starting with a simple question – “how different is the forecast in the sponsor model from what’s happened in the past” – can use the answer to determine how much time to put into due diligence, or how much risk to price into the investment. REmap is helping investors make these decisions more efficiently with centralized, easy access to the historical and forecasted data they need.

For more information on REmap, or REview, which is helping investors evaluate the basis risk of their current portfolio, contact [email protected].

Learn more about REmap:
See what’s coming from REmap on the forecasting front
Learn how investment firm Hannon Armstrong is using REmap

Return to the blog post main menu.

Q2 2022 REmap Report

Q2 2022 State of the Renewables Market report

REsurety creates the REmap-powered State of the Renewables Market report every quarter to provide readers with data-driven insight into the emerging trends and value of renewables in U.S. power markets. We combine our domain expertise in power markets, atmospheric science, and renewable offtake to analyze thousands of projects and locations and summarize key findings here. All of the data behind this analysis is available via our interactive software tool, REmap. Please fill out the form at the bottom of the page to access the full report, the Editor’s Note is below.

Blair Allen, Editor of the Q2 2022 State of the Renewables Market report

Blair Allen
Director, Software Customer Success, REsurety

Editor’s Note:

Node to hub basis* is rapidly becoming one of the most prominent financial risks for renewable developers and clean energy buyers alike. Although not a new issue, it has recently become more visible for two reasons: first, it is getting much worse in many areas with a lot of renewables, and second, clean energy buyers are increasingly taking on basis-risk exposure through contractual terms in PPA agreements. While basis used to be a risk only borne by project developers and investors, now corporates are sensitive to it as well.

In Q2, a handful of renewable-rich regions saw generation-weighted (AsGen) basis worsen by double digit values relative to the 4 year Q2 average. In many cases this was most prominent in areas that were already no stranger to negative basis. In ERCOT South Hub, for example, the average AsGen basis for operating wind projects in Q2 over the last 4 years was -$11 – in 2022 it declined to -$34. In the NP15 region of CAISO, the average AsGen basis for operating solar projects dropped from -$9 over the last 4 years to -$27 in 2022. And in SPP South Hub, operating wind projects saw their 4 year average decline from -$9 to -$31 in 2022.

But hub-level average values only tell part of the story, since basis is inherently a project-specific concern and can vary considerably not only within hub boundaries but across projects only miles apart from each other. For instance, when considering the projects within SPP South Hub last quarter, REmap shows project-by-project AsGen basis values that varied from as low as -$48 to as high as $26. The same extreme divergence played out across different ISOs and hubs, driven by subregional constraints driving a wedge in value between locations on either side of congested areas.

Basis warrants so much attention because it is extremely volatile and has a large impact on investment returns. In addition, it is hard to solve: investment into transmission infrastructure takes years and is extremely expensive. Developers screen for viable greenfield locations to avoid it, investors pore over model results to price it, and now energy buyers are turning to their advisors or tools to understand it better as well. The basis risk sharing clauses increasingly present in PPAs link the developer and clean energy buyer to the project’s basis performance in ways the two groups weren’t before, and the mechanics of that linkage aren’t always well understood. Although its impact ultimately depends
on the counterparty and the project-specific contract details that can either worsen or improve exposure, one thing is clear: basis should be on everyone’s radar.

In this Q2 REmap report, we analyze a number of metrics including: shape, capacity factor, and AsGen value of power for renewables domestically. REmap users have real-time access to these metrics and more, including basis analysis, through the map-based SaaS offering.

*AsGen basis is defined in this report as the difference between a project’s AsGen nodal price ($/MWh) and its hub price ($/MWh), where the hub is assumed to encompass the area where the node is located.

Q2 2022 REmap Report Download

"*" indicates required fields

Name*
This field is for validation purposes and should be left unchanged.

Return to the blog post main menu.

Media Advisory: Prolonged periods of negative pricing in Q1 set new record

Blair Allen

REsurety’s REmap Q1 State of the Renewables Market report presents generation-weighted value, shape value, and capacity factor for major U.S. hubs

BOSTON, MAY 10, 2022 – The U.S. power grid saw record lows in the first quarter of 2022, REsurety’s REmap Q1 2022 State of the Renewables Market Report finds, with prolonged negative pricing in Texas expected to ease this summer.

Unlike the soaring prices of last year during the Texas energy crisis of February 2021, this year the ERCOT power grid saw record lows in Q1. It was another turn in a developing plotline REsurety commented on last quarter. 

One example: In February 2021, ERCOT West Hub (among others) settled at the market price cap of $9,000/MWh for three days; in February 2022 ERCOT West Hub saw a two day period where prices never rose above $0/MWh. Mild demand coupled with sustained periods of high wind and solar generation created the conditions for this negative pricing event, though these conditions weren’t isolated to only those few days. In fact, by the end of the quarter, West Hub more than doubled the number of negative-priced hours than were seen in Q1 the year prior.

REsurety creates the REmap-powered State of the Renewables Market report every quarter to provide readers with data-driven insight into the value and latest emerging trends of renewables in U.S. markets. The team uses its knowledge in power markets, atmospheric science, and renewable offtake to analyze thousands of locations, and summarize a few key findings, using the data that is available via its interactive software tool, REmap.

Key components in the report to be used to analyze trends in a given ISO, sub-regions of an ISO, or hub, are:

  • The generation weighted value, or the realized value of the wind and solar projects 
  • The shape value, or the relationship between the generation value and the simple-average market price
  • The net capacity factor for operating wind and solar projects 
Blair Allen, Director, Software Customer Success, REsurety
Blair Allen

“Using the modeled energy in REmap, which tells us how projects could have performed based on underlying wind/solar resource availability, last quarter West Texas solar projects saw anywhere from 20 to 30% of their potential hourly production for a given month happen in negatively priced hours. However, in reality, these projects weren’t operating at their potential capacity in these intervals, and either shut down or significantly ramped down production,” reports Blair Allen, Director, Software Customer Success, REsurety. 

Over the next quarter as the weather starts to transition to summer conditions negative pricing is expected to decline. With an increase and shift in demand, Q2 will likely be a transitional period, with the frequency of negative pricing hours remaining high to start before subsiding more materially by the end of the summer in mid Q3. 

The power of REmap lies in the historical and predictive modeling for renewable energy projects across the United States, as well as the ability to analyze hypothetical installations. Learn more by reading the Q1 report

About REsurety

REsurety is the leading analytics company empowering the clean energy economy. Operating at the intersection of weather, power markets, and financial modeling, we enable the industry’s decision-makers to thrive through best-in-class value and risk intelligence, and the tools to act on it. For more information, visit www.resurety.com or follow REsurety on LinkedIn

Contact:  Allison Lenthall, [email protected], +1-202-322-8285


Return to the press release main menu.

Disclaimer.

Q1 2022 REmap Report

REsurety creates the REmap-powered State of the Renewables Market report every quarter to provide readers with data-driven insight into the emerging trends and value of renewables in U.S. power markets. We combine our domain expertise in power markets, atmospheric science, and renewable offtake to analyze thousands of projects and locations and summarize key findings here. All of the data behind this analysis is available via our interactive software tool, REmap. Please fill out the form to access the full report, the Editor’s Note is below.

Q1 2022 State of the Renewables Market Report

"*" indicates required fields

Name*
This field is for validation purposes and should be left unchanged.

Blair Allen, Editor of the Q1 2022 State of the Renewables Market Report

Blair Allen
Director, Software Customer Success, REsurety

Editor’s Note: As the first quarter of 2022 concludes, we reflect on historic highs and historic lows. Another record in ERCOT marks the quarter’s passing, just as one did a year ago following the market events of February 2021. However, unlike the soaring prices of last year, this record involves a prolonged period of negative pricing, and another turn in a developing plotline we commented on last quarter. Please fill out the form below to access the report.

Consider this comparison: in February 2021 ERCOT West Hub (along with others) settled at the market price cap of $9,000/MWh for three days; in February 2022 ERCOT West Hub saw a two day period where prices never rose above $0/MWh. Mild demand coupled with sustained periods of high wind and solar generation created the conditions for this negative pricing event, though these conditions weren’t isolated to only those few days. In fact, by the end of the quarter, West Hub would more than double the number of negative-priced hours than were seen in Q1 the year prior.

One impact of this increasing frequency in negative pricing is rising levels of curtailment, particularly among solar projects which, unlike wind, don’t benefit from the production tax credit and are less likely to operate below $0/MWh. For example, using the modeled energy in REmap, which tells us how projects could have performed based on underlying wind/solar resource availability, last quarter West Texas solar projects saw anywhere from 20 to 30% of their potential hourly production for a given month fall in negatively priced hours. However, in reality these projects weren’t operating at their potential capacity in these intervals, and either shut down or significantly ramped down production.

Another important angle to consider: whereas for the last few years hourly negative prices at West Hub were evenly split between on-peak and off-peak hours during this time of year, this year saw that balance shift to 60/40 in favor of on-peak hours. The cause for this shift is clear: increasing amounts of solar capacity means that low pricing is no longer just following the production profiles for wind, and is coinciding more regularly with the rise and fall of solar energy.

Looking ahead, as seasons change into summer conditions so too do we expect a change in the volume of negative pricing. An increase and shift in demand– which will steadily move more towards the mid afternoon as air conditioning ramps–and a decline in wind production at the same time should converge to steadily mitigate on-peak negative price frequency. Q2 will likely be a transitional period, with frequency of negative pricing hours remaining high to start before subsiding more materially by the end of the quarter.

Return to the blog posts main menu.

Confidently Partner on Renewable Project Investments Using REsurety: HASI Case Study

HASI logo

We sat down with Rich Santoroski, Chief Risk Officer & Co-Head, Portfolio Management, and Raj Singamsetti, Market & Regulatory Lead of the climate investment firm HASI, to talk about how they use REsurety to conduct investments in renewable projects. 

With more than $8 billion in managed assets, HASI’s (NYSE: HASI) core purpose is to make climate positive investment with superior risk-adjusted returns. The company’s vision is that every investment should improve its climate future, which is why they require that all prospective investments are neutral to negative on incremental carbon emissions or have some other tangible environmental benefit, such as reducing water consumption.

HASI logo

We use REsurety in every deal because we trust it to help us to understand real world performance and to determine the appropriate value of an investment.” 

Rich Santoroski, EVP, Chief Risk Officer, & Co-Head – Portfolio Management, HASI

Learn how HASI uses REsurety’s Project Explorer

Confidently Partner on Renewable Project Investments Using REsurety: HASI Case Study

Note: What was historically known as REmap, is now referred to as two separate tiles in the REsurety platform, Project Explorer and Carbon Explorer.

Return to the main menu of customer stories.

Marathon Helps Clients Choose the Right Renewable Opportunities Using REsurety

REsurety sat down with Joan Hutchinson, Managing Director at Marathon Capital, to talk about how her team uses REsurety to inform their corporate clients on renewable energy procurement.

ABOUT MARATHON CAPITAL: Marathon Capital is a world-class investment bank with a mission to achieve their clients’ strategic and financial objectives by delivering inspired, knowledge-based solutions to the clean power, sustainable technologies & infrastructure markets. Marathon Capital is a leader in transformational deals across the global clean energy landscape bringing over 20 years of renewable energy and clean technology experience.

Cover of Marathon Helps Clients Choose the Right Renewable Opportunities Using REsurety

Note: What was historically known as REmap, is now referred to as two separate tiles in the REsurety platform, Project Explorer and Carbon Explorer.

Return to the main menu of customer stories.

Summer 2020 Brought ERCOT Market Challenges, But Nothing Like 2019

REsurety icon

REmap harnesses weather and power market data to show how wind and solar producers were financially impacted in August 2020 in ERCOT.

The Texas power market made headlines in August 2019 when wholesale prices for electricity repeatedly spiked close to and even hit the $9,000-per-megawatt-hour (MWh) cap. This August, average hourly prices peaked at “just” $1,700 per MWh, the afternoon of Aug. 15.

There were many reasons for the reduced price volatility in Texas this year. First, it was hotter in Texas in August 2019, reaching 104 degrees in Houston on Aug. 13 and 14, versus this year’s high of 99 degrees on Aug. 16.

Peak demand was close to the same—74,820 MW on Aug. 12, 2019, versus 74,164 MW on Aug. 13 of this year, across ERCOT, the main Texas grid. But ERCOT’s reserve margins have increased since last year with the addition of new capacity—most notably solar.

‘Shape’ Of Texas Wind This Summer Spared Price Spikes

In ERCOT, we see that production-weighted prices for wind projects in August 2020 ranged from good to not-great. Most wind projects saw production-weighted prices in the high $10s to low $20s per MWh. Projects near the Gulf Coast were again the standout, getting into the $40s and $50s per MWh.

As we added data for this August and removed last August, the trailing 12-month average pricing for wind projects decreased across all of ERCOT’s major trading hubs, with prices now close to or dropping below all-time lows. But financial performance for clean energy buyers and sellers should also be measured through the “shape” metric.

Shape measures the value of a clean energy project’s generation relative to the value of baseload power. So for example, a renewable energy project that generated power only worth an average of $20 per MWh during a month when baseload power averaged $30 per MWh would have a negative $10 per MWh shape.Figure 1. In August 2019, the most negative wind shape values were concentrated in the northeast part of Texas, whereas in this map from August 2020, the most negative shape values were concentrated in the northwest part of the state. Coast wind projects fared best.

The August 2020 shape (Figure 1) for wind projects ranged from -$15 per MWh relative to baseload, to more than +$16 per MWh, with the vast majority of operating projects falling toward the bottom of that range. While this is admittedly a volatile range, it pales in comparison to last summer, which saw wind project shape values as negative as -$111/MWh and as positive as $84/MWh.

Across both summers, the highest positive shape values were reserved for the few projects operating directly along the ERCOT coastline.

Solar Outperformed Wind, Though Moreso in 2019

For solar producers in ERCOT, meanwhile, production-weighted prices in the real-time market ranged from the low $50s per MWh to the low $60s per MWh. These prices were much higher than wind, but a far cry from last August, when Texas solar fetched rates nearing $350 per MWh.

Solar shape in ERCOT this August ranged from positive ($17 per MWh relative to baseload) to very positive (into the $30s per MWh). In August 2019 that positive shape ranged from the $80s to north of $200 per MWh—reinforcing how last August was comparatively more volatile, but also resulted in a higher payout for solar projects across the board.

However, it is worth highlighting here that a positive shape as compared to baseload power does not necessarily mean strong financial performance for a solar project, as its hedging strategy can cause high sensitivities to poorly-timed cloud cover. 

The image below (Figure 2) shows the shape value of solar in August 2020 when we compare the as-generated value of power against the average hourly generation profile (the “12×24 shape value”)—a structure that is used in some financial hedges for solar projects.

The cause of the disparity between the shape winners and shape losers during this period was primarily driven by a few hours of cloud cover, seen in the accompanying cloud cover photograph. (There was a similar story to tell in California this August, with ill-timed cloud cover hurting solar generation during price spikes).Figure 2. August 2020 “12×24” solar shape values in West Texas were materially impacted by cloud cover, dipping lower than -$5/MWh in the ERCOT West real-time market.

REmap lets us leverage atmospheric science, power market modeling and big data to bring unprecedented transparency and insight to the clean energy industry — empowering better decisions, faster.Figure 3. Cloud cover over ERCOT during an afternoon price spike on Aug. 31, 2020. Source: NEXLAB, College of Dupage

The lessons we draw from examining August 2020 and August 2019 region- and project-level performance highlight how weather and its timing can impact clean energy financial performance. Temperature, wind speed, and cloud cover (Figure 3)—and when they occur—are increasingly the drivers of success for a given project or off-take contract.


Reposted as in Power Magazine.

Return to the blog posts main menu.

REsurety launches REmap, expanding the industry’s access to critical value & risk analytics

REsurety icon

Map-based SaaS tool provides unprecedented transparency and insight into clean energy markets, illustrating today how COVID-19 has impacted renewable projects and driven record-setting low prices.

BOSTON, May 28, 2020 /PRNewswire/ — A new information services product that harnesses a massive project performance dataset and suite of financial analytics that industry leaders use to make long-term asset and contract decisions for wind and solar energy has revealed that the low energy demand during the coronavirus shutdown, combined with low natural gas prices and high renewable generation, has resulted in unprecedented low power prices in multiple U.S. markets.

REsurety, the industry leader in clean energy valuation and risk analytics, said the insights available from its Renewable Energy Market Analytics Platform (“REmap”) include that the production-weighted wholesale price of electricity for wind projects fell to all-time lows during the COVID-19 pandemic across markets including SPP, PJM and MISO – with extreme lows reaching below $2 per MWh for the entire month of April in high wind penetration regions such as Oklahoma.

REsurety today is publicly announcing the launch of its REmap information service. The REmap tool integrates weather and power market data at an unprecedented scale, calculating hourly financial performance for 15,000 operational and greenfield locations, which REsurety uses to provide clients with the industry-wide context and site-specific depth of insight needed to make better decisions faster. 

“We’re expanding the access to our secret sauce,” said REsurety CEO Lee Taylor. For years, REsurety has used its proprietary data and analytics to support the analysis of hedging instruments. Now, through REmap, REsurety makes that insight available by subscription to support a much broader set of use cases, including greenfield prospecting, M&A diligence, and offtake and hedge analysis.

“Clean energy markets are going through a revolution,” Taylor added. “The scale and complexity of risks facing clean energy projects and their offtakers are at an all-time high. Understanding and managing those risks requires a step change in information – and that’s why we built REmap.”

REmap leverages REsurety’s unique expertise at the intersection of atmospheric science, power market modeling and big data. Billions of data points from many sources are collected, cleansed, and analyzed to provide the financial metrics that are critical to renewable energy decision makers’ success. Existing customers include developers, hedge providers, C&I buyers, and advisors.

“REmap is a sea change in the access to quantity and quality of data,” said Joan Hutchinson, Managing Director of Marathon Capital, an early REmap client. “It has assisted Marathon in providing our clients with data-driven insights and solutions efficiently – even before project data is shared.”

Jim Howell, CEO of Birch Infrastructure, also a REmap client, commented, “Identifying the optimal location to invest in renewables has always been somewhat of a dark art – relying on intuition and point-specific analyses. REmap gives us the information we need to truly optimize our procurement and hedging activities.”

Reposted as in PR Newsire.

Return to the press release main menu.