December 5, 2023
A view of Q3 2023 U.S. renewable energy performance
REsurety creates the State of the Renewables Market report every quarter to provide readers with data-driven insight into the value and emerging trends of renewable generation in U.S. power markets. Please fill out the form to access the full report, the Editor’s Note is below.
Editor’s Note:

Lead Analyst
Senior Analyst, Analytics Services

Editor
SVP, Analytics Services
A Tale of Two Technologies
When I think of Southwest Power Pool (SPP) I think of wind. Wind met almost 40% of SPP demand in 2022 and new output records have been consistently set over the past couple of years. When I think of SPP I don’t think of solar, though. Solar met less than 0.5% of SPP demand in 2022. And I’ve always found that a little surprising considering the southern SPP footprint has some of the best solar resource in the country (ref: NREL). Maximum solar output this summer in SPP was only 30 MW higher than 2022 while the equivalent metric in ERCOT increased by more than 3,500 MW.
The abundance of wind generators and the lack of solar also means the two technologies look very different when considering two important metrics – the monetary value and the decarbonization impact of each MWh.
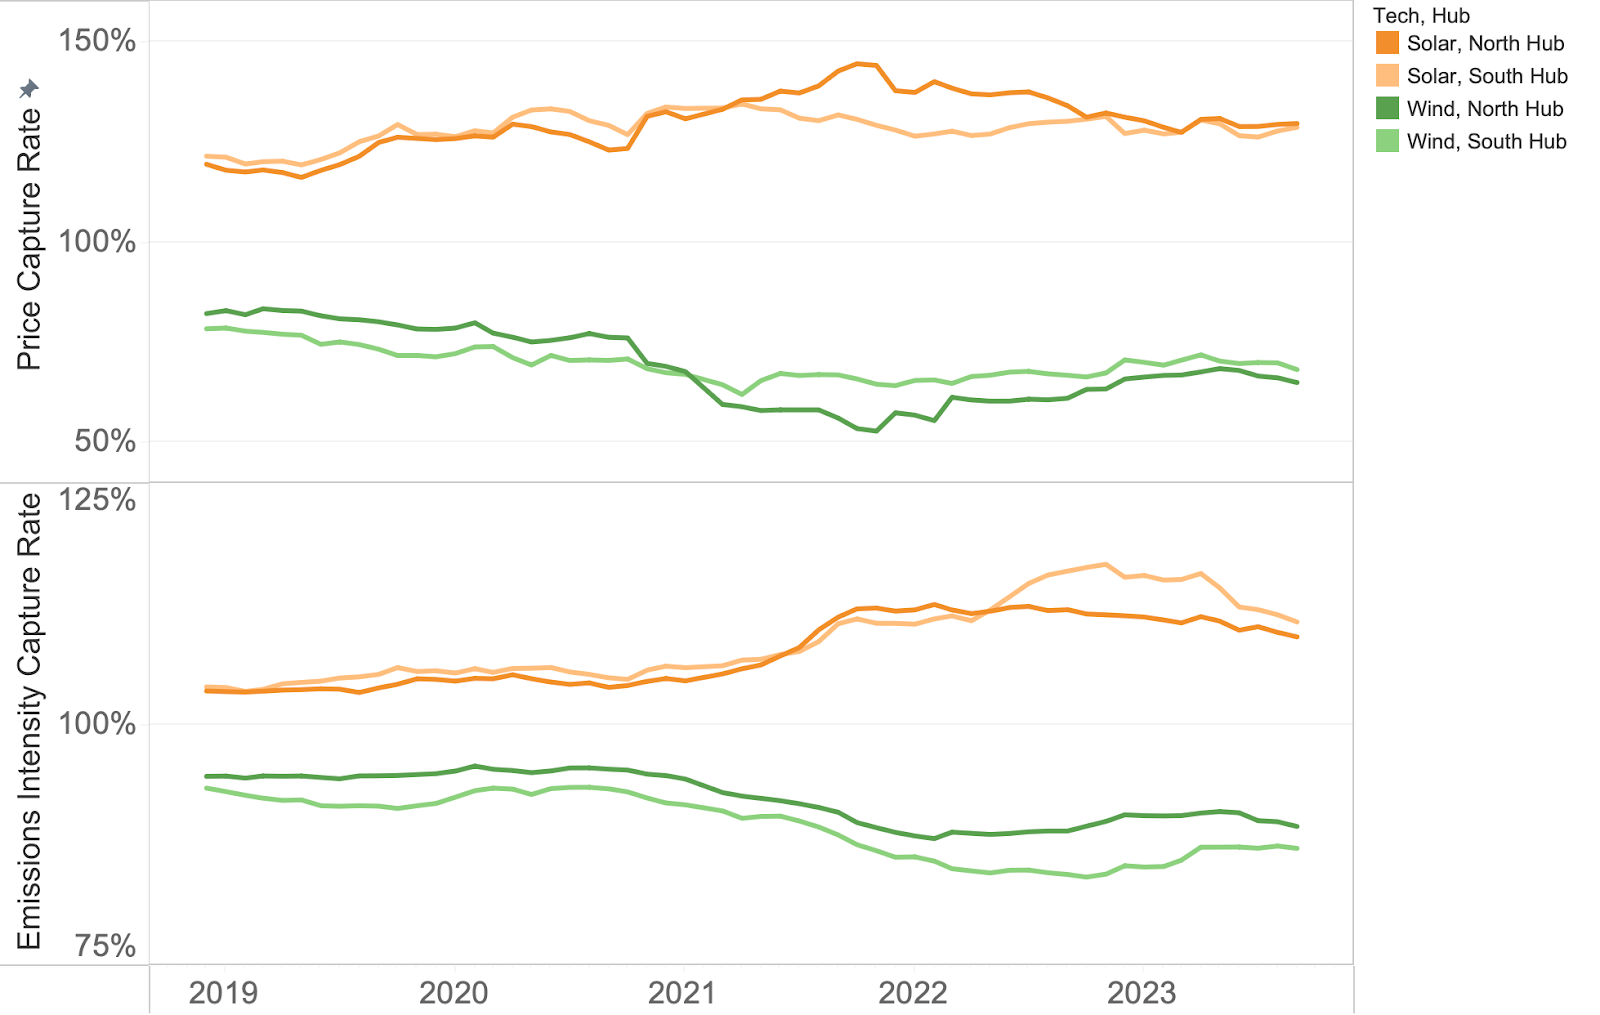
Figure 1 shows the capture rates (the value of the wind or solar-weighted MWh compared to around-the-clock MWh) for both price and emissions intensity. We see similar trends in both – wind is capturing less and less of the available monetary value and avoiding less and less CO2 while the opposite is true for solar.
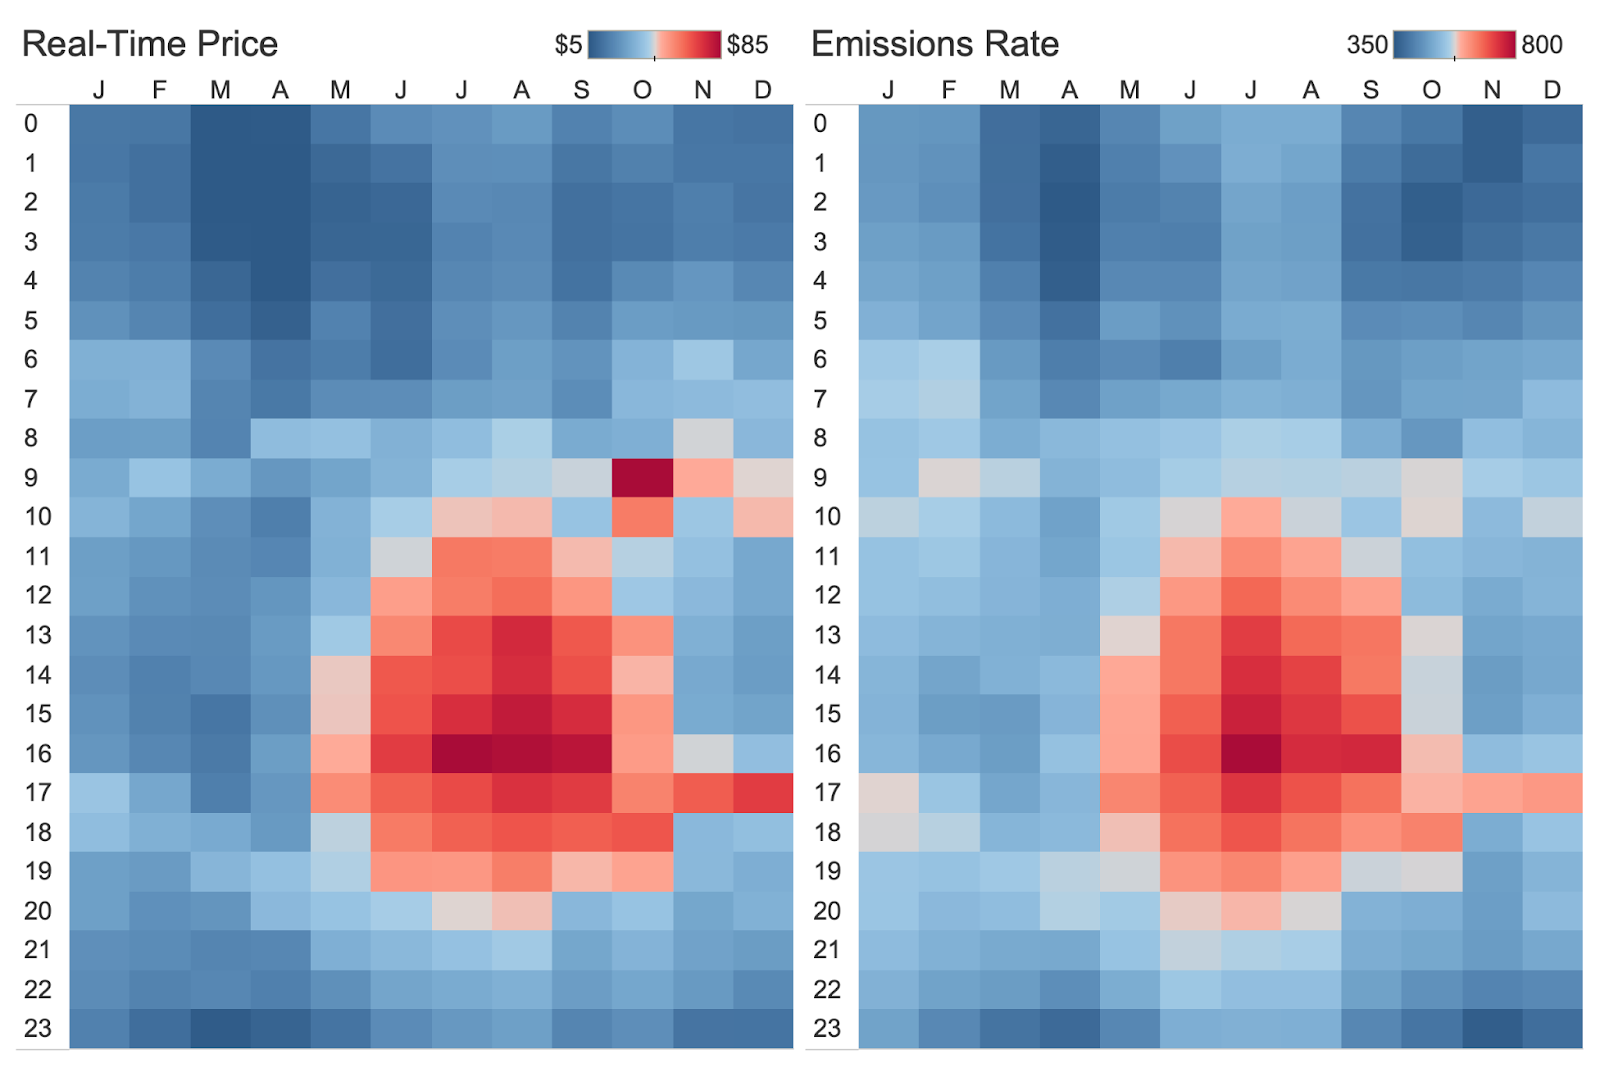
To understand what’s causing this we can look at the month-hour average prices and emissions rates over the past four years. We see that both prices and emissions rates are highest during the summer afternoons. During these times load is high and often wind output is low, meaning the marginal unit is a thermal generator with higher emissions rates. Of course, these are the same hours when solar output is peaking and that correlation leads to high solar value (in $ and CO2 avoidance terms) compared to an around-the-clock generation profile. Conversely, the low prices and low emissions rates are occurring (not coincidentally) in hours of high wind output and this drives the prices and emissions rates lower.
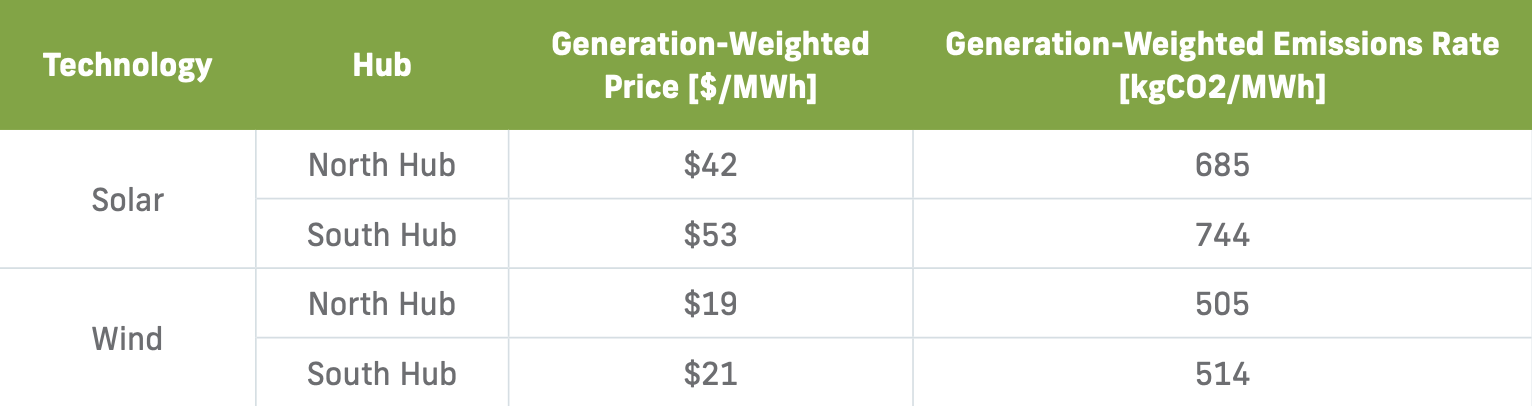
On the face of it, this means adding solar to SPP would be a win-win, it would capture relatively high value power prices and would displace thermal generators more often, avoiding more carbon emissions. In Q3 of this year, solar was worth more than $50/MWh at South Hub while wind was worth closer to $20/MWh. During the same period, solar generation also had a 40% larger emissions reduction impact compared to wind.
So why aren’t more solar projects being built? There are a number of challenges, but transmission is a considerable one. The interconnection queue is long and growing thanks to the IRA, and getting an interconnection agreement often requires developers to share large upgrade costs. Further, this analysis reflects the hub values for prices and emissions. Wind projects in SPP suffer some of the worst price basis in the country with some projects seeing $10-20/MWh annual nodal discounts vs. the hub. Investment tax credit (ITC)-qualified solar projects would likely need to curtail output as soon as prices reach negative territory while production tax credit (PTC)-qualified wind projects tend to continue operating far beyond that point.
There’s currently value available for solar in SPP but only if project developers can navigate the complex issues related to transmission, interconnection, and congestion.
Q3 2023 Report Download
"*" indicates required fields
Return to the blog post main menu.