February 5, 2024
A view of Q4 2023 U.S. renewable energy performance
REsurety creates the State of the Renewables Market report every quarter to provide readers with data-driven insight into the value and emerging trends of renewable generation in U.S. power markets. Please fill out the form to access the full report, the Editor’s Note is below.
Editor’s Note:

Lead Analyst
Senior Analyst, Analytics Services

Editor
SVP, Analytics Services
Emissions (Rates) Ignore (ISO) Borders
As of the end of 2023, Locational Marginal Emissions data is available for all seven deregulated ISOs in the U.S. That additional data coverage is reflected in the later parts of this report. Here, we’re going to dig into what the data can tell us about the current state of the different ISOs and how it can shine a light on the current hydrogen-hourly matching debate.
All the data included in this analysis is for the period November 2022 – October 2023.
1. Renewables projects in CAISO, and particularly solar, had the lowest environmental impact.
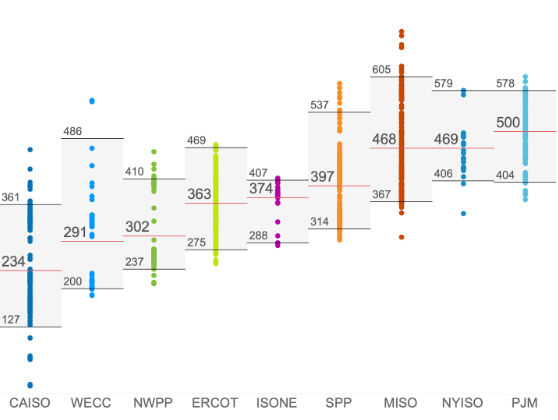
There’s already a lot of solar power installed in California, and that means during the day when the sun is shining, solar power is often the marginal generator. That means incremental solar generation is displacing clean megawatt-hours from other solar projects, not fossil-based generators. The average renewable energy project in CAISO during this 12-month period displaced only 234 kgCO2e/MWh. That’s less than half the emissions impact of the average renewable energy project in PJM.
2. PJM is where renewable energy has the biggest environmental impact.
A combination of relatively low penetration rates for renewables and fewer transmission constraints means there’s an outsized impact for any new wind or solar project in the PJM footprint because it is often displacing fossil-based generators and rarely displacing other renewables. On average, a renewable energy project in PJM displaced 25% more CO2 than an equivalent project in SPP and almost 40% more than projects in ERCOT.
3. There is a huge range of emissions rates within most ISOs.
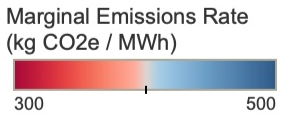
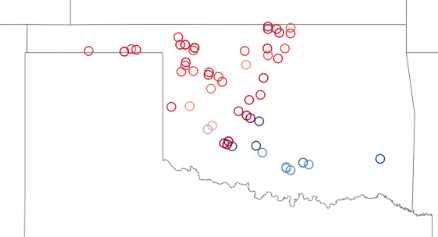
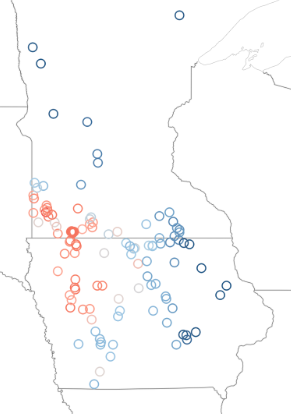
It’s perhaps more intuitive to make sense of the differences in average emissions impacts between ISOs – each has its own unique generation stack, load profile, and set of connections with neighboring regions, resulting in different emissions rates for renewables. However, there’s an even bigger range of emissions rates within these regions. This is primarily driven by the unique local transmission constraints within each region and how each of these constraints affects the ability of renewable generation to meet load. Two examples of localized variability in emissions impact are shown in figures 2 and 3. In both southern Oklahoma and western Minnesota, the emissions impact of wind projects is reduced due to local transmission constraints and congestion.
This last point about intra-regional variability is interesting for a number of reasons, but one to specifically call out here is the current debate around the IRS guidance for hourly matching of renewables for hydrogen electrolyzers under Section 45V of the Internal Revenue Code. The latest IRS proposal requires hourly matching of electrolyzer consumption with renewable energy procured within the same ‘region’. While the hourly matching regions don’t precisely match ISO boundaries, they’re pretty close. Therefore, the intra-regional variation in emissions impact for renewable energy projects would likely translate directly to the real-world emissions associated with ‘green’ hydrogen. An electrolyzer could procure renewable energy from a high-performing project in the region and avoid a lot more carbon than the electrolyzer consumes. The more worrying possibility is the opposite scenario – buying power from an underperforming project could mean that the hydrogen produced is actually far from ‘green’.
In addition to downloading the report, you may want to register to attend a webinar on the topic on Wednesday, February 7 at 1pm ET with the editor, Carl Ostridge. He’ll share findings, insights, and host a live Q&A.
Q4 2023 Report Download
"*" indicates required fields
Return to the blog post main menu.


