July 30, 2021
1. Modeled Q2 PPA Performance Across Major Hubs
REmap’s new vPPA simulator feature allows users to backcast vPPA settlement at all project locations, enabling analysis of market performance through the lens of a generator or vPPA buyer.
vPPA settlements represent the value (or cost) of the unit-contingent contract-for-difference hedge settlements that result from a virtual Power Purchase Agreement (vPPA) with a project.
The results below show modeled¹ vPPA settlement values (in $/MWh) from the energy buyer’s perspective over the course of Q2. For potential vPPA buyers, this data answers the question: “If I signed a vPPA at prices available today, how would it have performed this past quarter?”
Modeled vPPA settlement outside of ERCOT generally resulted in a cost for the vPPA buyer, even assuming today’s competitive PPA prices². Within ERCOT, vPPA settlement favored the vPPA buyer, with settlement values surpassing $25/MWh at some Texas solar projects. The cost of purchasing renewable energy through a vPPA was greatest for energy buyers with a wind vPPA settling at SPP North Hub, SPP South Hub, or PJM AEP-Dayton Hub. Solar vPPAs were most costly for projects settling at PJM Eastern Hub or MISO Michigan Hub.
Q2 2021 Modeled vPPA Settlement for Energy Buyers
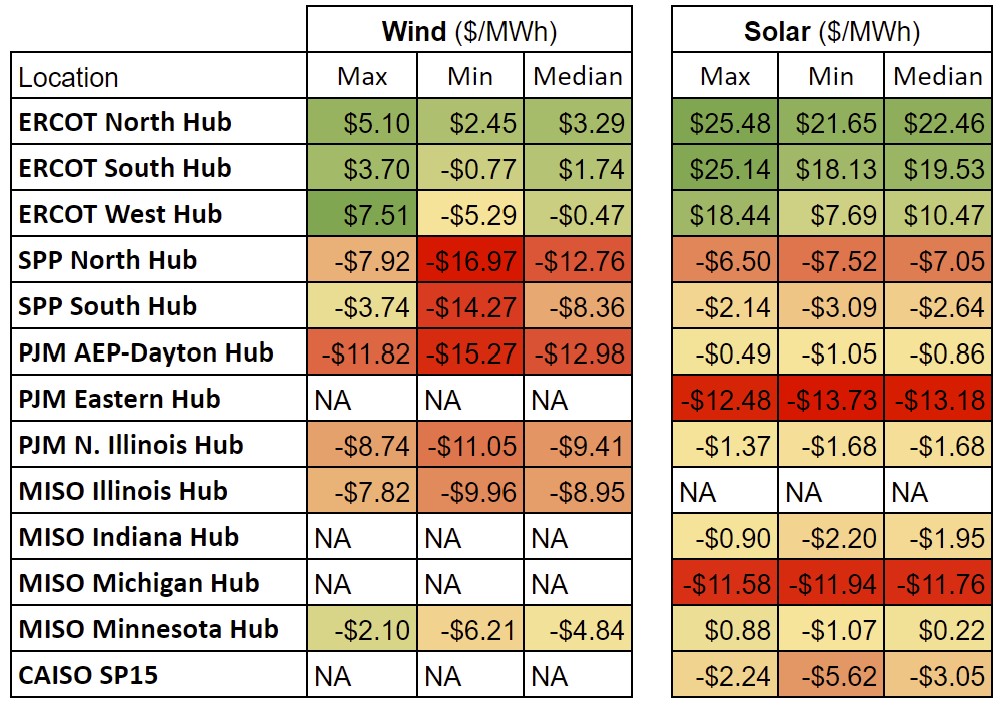
¹ Results use REmap data for operating projects, which includes modeled and observed hourly generation and observed market prices. Cell values represent the project with the maximum, minimum, or median project settlement value to an energy buyer for the quarter.
² vPPA prices used are from the LevelTen Q2 2021 PPA Price Index, which reports on PPA bids by hub and technology type.
2. Coastal Texas Wind Projects Join the Rest of the Pack
Coastal wind projects in Texas tend to experience higher wind speeds in the afternoon hours, which typically aligns well with afternoon periods of high demand and high power prices. The ability to generate during high priced afternoon hours means coastal projects typically benefit from a positive shape (also known as covariance), whereas wind projects in the rest of Texas tend to experience negative shape (i.e., hours of high generation are negatively correlated with hours of high power prices).
However, in Q2 2021, coastal projects were not quite as fortunate. Shape profiles throughout all of ERCOT were quite negative, including coastal projects. Projects directly along the coast experienced shape discounts of $7-9/MWh, in line with other projects throughout the state. Figure 2a puts that in context of other ERCOT projects in Q2 2020 and 2021.
Q2 2021 Average Shape Values for Operating ERCOT Wind Projects
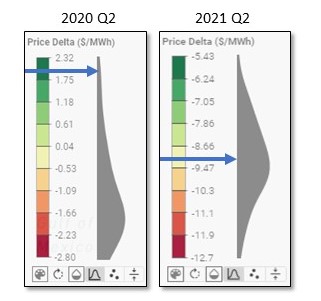
As an example: Stella Wind Farm, a coastal project in Kenedy County, experienced -$7.36/MWh average shape in Q2 2021, while its prior 5 year average for the same quarter was $0.66/MWh.
Why did coastal Texas wind projects not do well relative to historical performance?
Continuing to use Stella Wind Farm as an example, we can review the hourly performance in REmap using the Hourly Data Explorer.
Figure 2b below shows the hourly data for Stella from April, a month in which the project’s shape value dropped to -$9.32/MWh. The top chart shows the hourly real-time hub price at ERCOT South and the bottom chart shows the hourly observed energy from Stella over the entire month.
April 2021 Hourly Hub Price and Generation Data
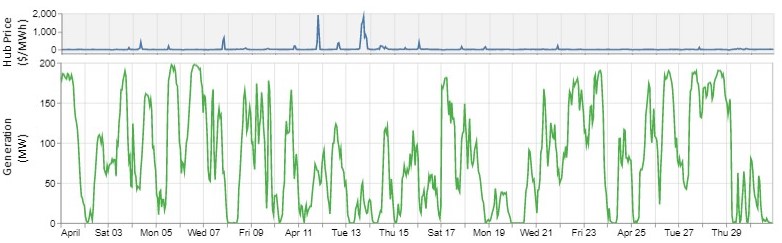
Looking at Figure 2b, we can identify two periods of elevated prices, on April 11th and 13th, when prices spiked to over $1800/MWh.
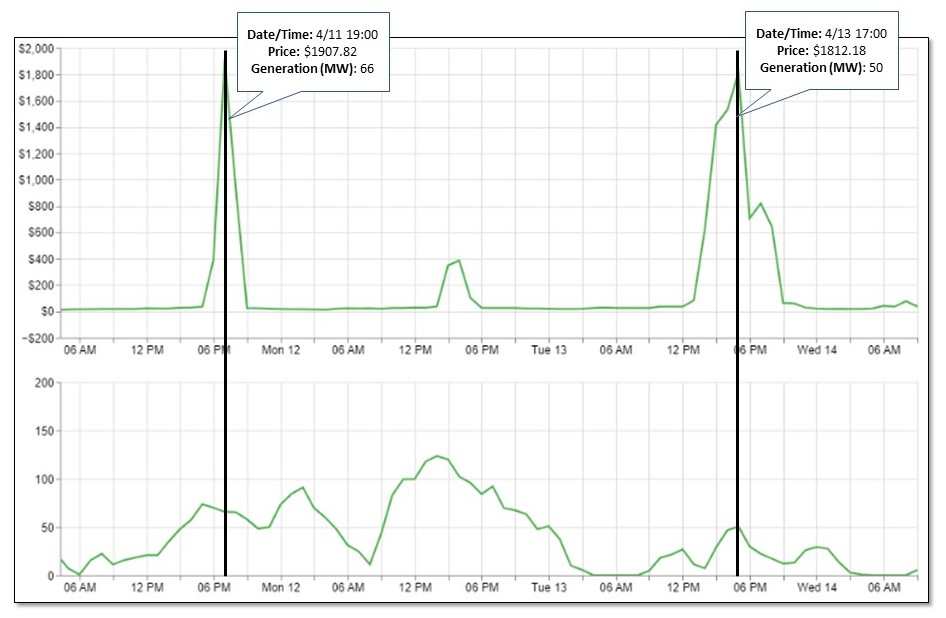
Zooming into the relevant period in Figure 2c, we can see the hourly alignment between price and generation for those days. During both high price events, generation was fairly low.
Hourly Hub Price and Generation Data for April 11th and 13th
3. Wide Basis Spreads for Wind Projects in Northern MISO
Last quarter, nodal prices for operating wind projects across North Dakota, Southwest Minnesota and Iowa continued a year-long trend of decline–with a precipitous drop.
To use one project as an illustrative example, Emmoms-Logan Wind saw a -$17.30/MWh node-to-hub basis value in Q1 2021, which was among the lowest of any operating wind project in MISO that quarter. In Q2 2021, its node-to-hub basis plummeted to -$44.20/MWh³.
If we use Emmoms-Logan’s Q1 performance as a benchmark and compare it to the Q2 performance for other operating wind projects in these states, the sharp decline in basis becomes more obvious. Figure 3a below shows operating wind projects in MISO. The color scale denotes historical node-to-hub basis value for Q2 2021, and the dark red areas denote any project that experienced an average basis value lower than -$17.30/MWh.
Q2 2021 Node-to-Hub Basis for Operating Wind Projects in MISO
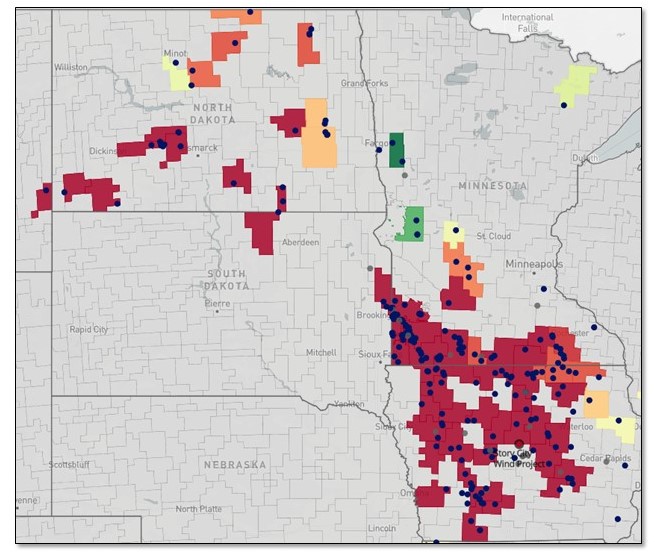
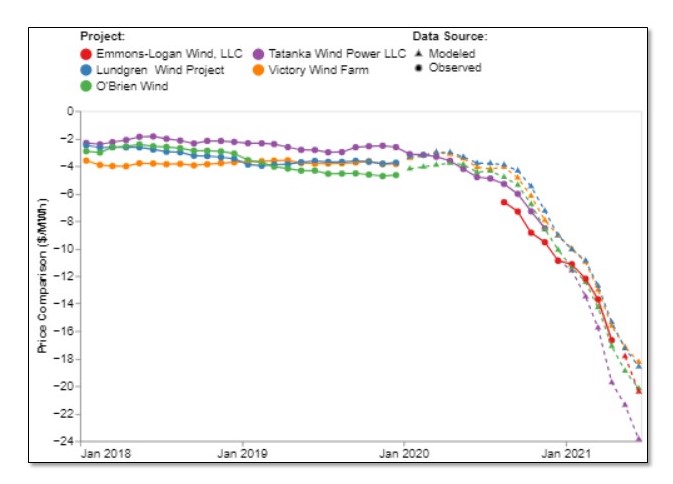
Figure 3b below shows the 12-month trailing basis for a handful of wind projects in Northern MISO, including Emmons-Logan, and illustrates that this trend has been over a year in the making, but dramatically accelerated in the past 12 months.
12-Month Trailing Generation-Weighted Basis for Selected MISO Wind Projects
Basis has been a known issue for project owners and operators and is increasingly a concern for vPPA buyers and offtakers who can be directly or indirectly impacted by basis depending on contract terms. Price data, provided by REmap, provides one critical piece of the puzzle. REmap’s generation data supplies the second critical piece, enabling users to see how much generation occurred in each hour and giving visibility into the impact of basis on project settlement.
³ Basis values are generation-weighted at the hourly level and use Minnesota Hub pricing. Generation is modeled. Actual results may differ.