December 5, 2023
The addition of these three markets now brings REsurety’s LME coverage to 6 out of 7 U.S. ISOs
REsurety customers are able to leverage LMEs to accurately calculate the impact of their activities at each location on the grid. The data enables an accelerated path to a zero carbon grid through activities ranging from more meaningful clean energy procurement to the more impactful dispatch of energy storage. In the end, LMEs can empower a higher overall carbon abatement per dollar spent.
Locational Marginal Emissions (LMEs) is a metric that measures the tons of carbon emissions displaced by 1 MWh of clean energy injected into the grid at a specific location and a specific point in time. LMEs are calculated at each location on the grid in a manner very similar to the Locational Marginal Prices (LMPs) used to set wholesale electricity market prices.
In order to provide carbon value insights across our customers’ full geographic scope, the team at REsurety has been working to make LME data available across more ISOs and we’re happy to announce that with the release of these three new ISOs, LMEs are now accessible across ERCOT, PJM, CAISO, MISO, SPP, and NYISO, substantially increasing our coverage. With these additions, nodal LME data is now available for over 75% of operational U.S. wind farms. We expect LMEs in ISONE to become available in Q1 of 2024.
The following examples demonstrate how users can:
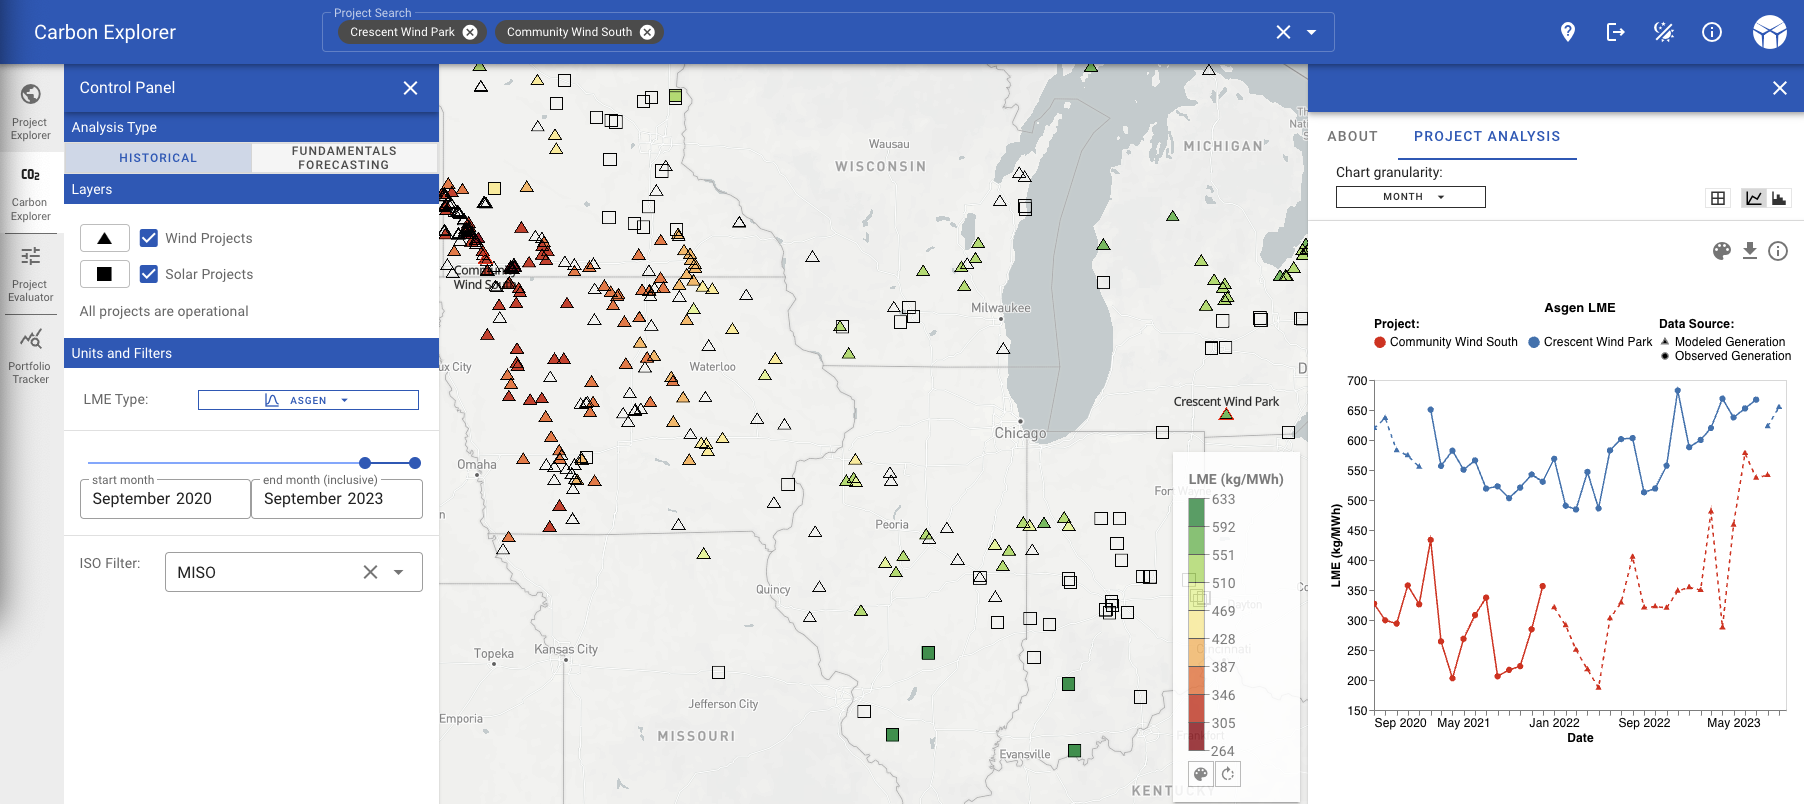
- Compare historical Locational Marginal Emissions rates of multiple projects on the same chart, and uncover the differences in performance across MISO; this example shows that one project can have twice the emissions impact of another project using the same technology within the same ISO.
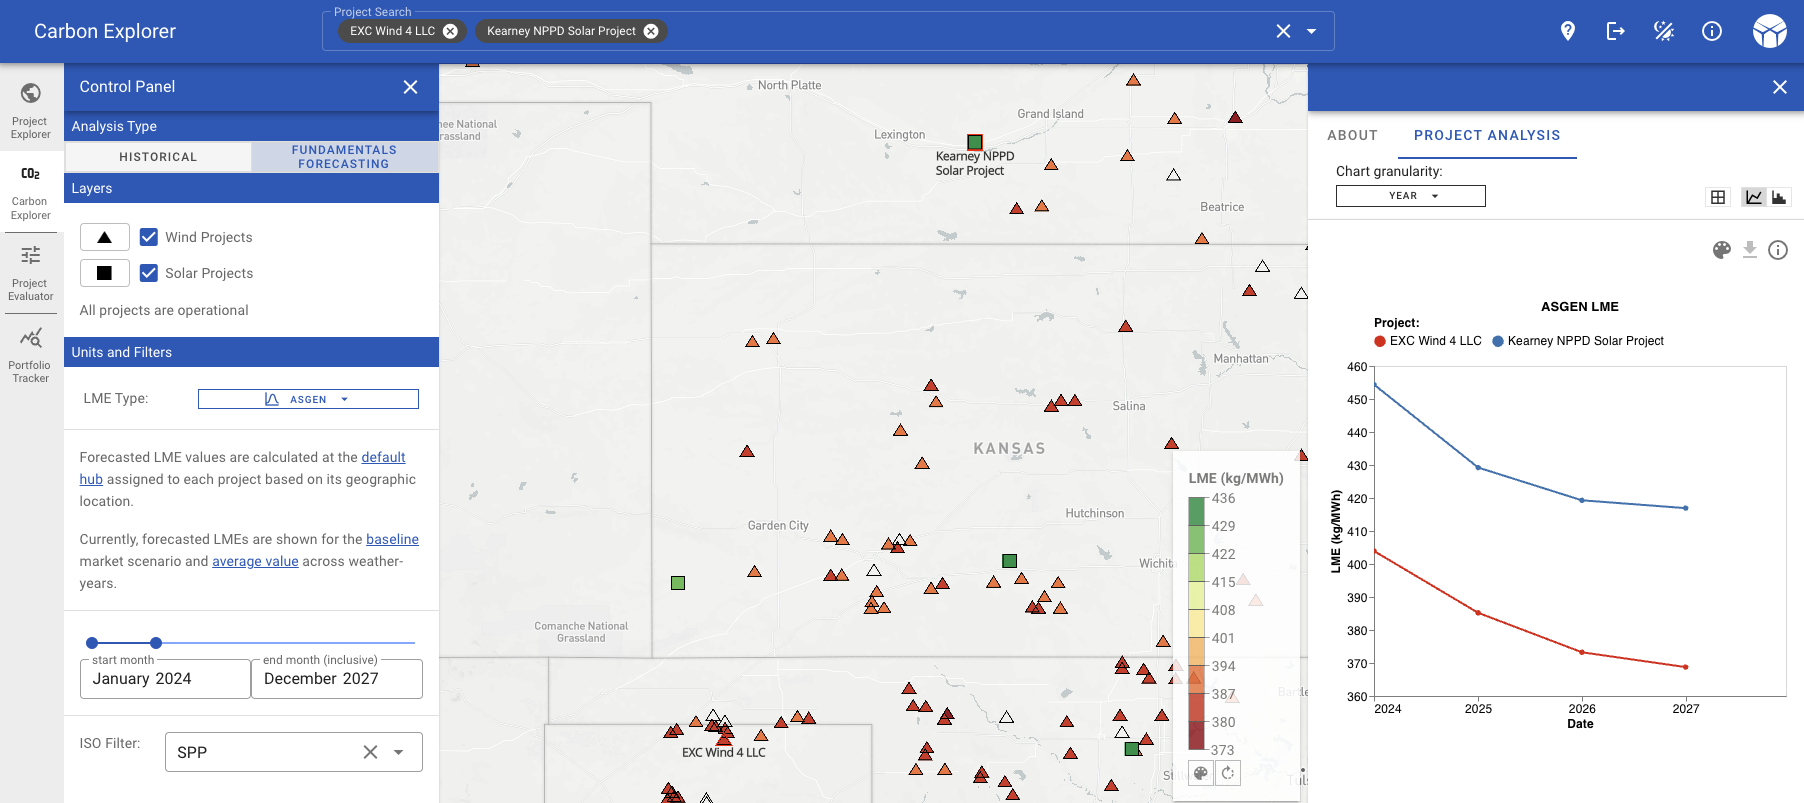
- Use REsurety’s Weather-Smart forecasting capabilities to analyze potential future carbon abatement rates across SPP; this example demonstrates how greatly emissions impact differs between wind and solar projects even at the hub level.
LMEs are available via custom reports, API access, and in REsurety’s SaaS offering, Carbon Explorer. Learn more by visiting http://resurety.com/lmes or contact us: https://resurety.com/contact.
Additional resources:
Locational Marginal Emissions White Paper
A Force Multiplier for the Carbon Impact of Clean Energy Programs
Akamai Technologies Case Study
“Solutions like what REsurety has brought to the market with LMEs bring the environmental community five steps closer to the measurement accuracy needed to solve the global emissions crisis. As a result, we are now confident in the emissions reduction our projects are causing and we have gained a partner we can trust to help us achieve our goals.”
Mike Mattera, Global Director of Corporate Sustainability, Akamai Technologies
Return to the blog post main menu.