
SVP of Power Markets Research
REsurety’s customers buy, sell, and invest in clean energy across the country and around the world. To provide our customers with financial and carbon value insights across their full geographic scope, we have been working to expand the coverage of our Weather-Smart forecasts. We are pleased to announce that with our recent Q2 2023 Weather-Smart release, we now provide forecasts in CAISO as well as ERCOT and PJM.
CAISO isn’t just one more market: it is an indicator of what is coming across the country. With an aggressive clean energy policy regime and strong solar resource, solar penetration in CAISO1 started growing early and is now the highest in the country. In 2022, solar penetration in CAISO was 28%, compared to 6% in ERCOT and 2.5% in PJM. But solar installations are now accelerating across the U.S. The changes CAISO witnessed in the last decade are in many ways a test case for what asset owners across the country can expect as solar penetrations grow.
The well-known LMP2 duck curve highlights an important implication of increasing solar penetration. Historically, prices tended to be high in the middle of the day due to high demand for electricity and the need to run more expensive peaking generators to meet that demand. However, as solar penetration grows, zero marginal cost solar generation is increasingly available during mid-day hours, leading to a decline in daytime prices. Peak price hours shift to the morning and early evening, when demand remains high, but solar output is low. This change in diurnal price profile has a material impact on the value of solar generation assets.
Figure 1 shows the evolution of the CAISO duck curve as solar penetration has increased over time. In 2012, solar penetration in CAISO was very low, the market did not display a duck curve, and the solar capture rate was well above 100%. By 2019, solar penetration had reached 20% and the lowest priced hours were at mid-day, with notable spikes in the morning and evening. Solar capture rate had fallen to 69%.
ERCOT is in the early stages of a similar evolution. Solar penetration in ERCOT in 2017 was insignificant, there was no discernible duck curve, and the capture rate was 117%. ERCOT hasn’t yet reached a 20% solar penetration, but by using REsurety’s Weather-Smart system, we can forecast what might happen when it does. In our Baseline scenario, ERCOT reaches 20% solar in 2031. Prices display a strong duck curve and the capture rate falls to 56%.
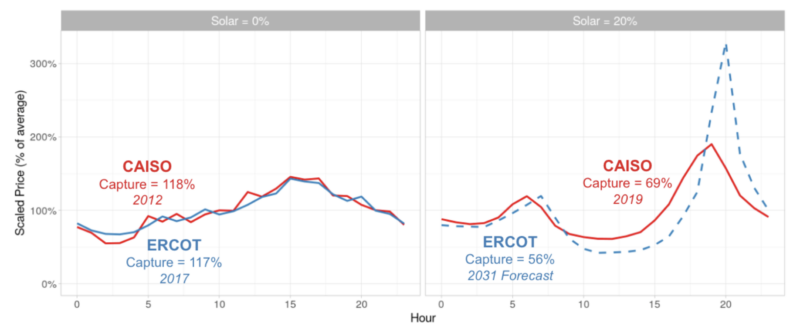
Notes: Y-axis represents the average price for each local-time hour divided by the annual average price. ERCOT prices reflect North hub real-time prices. CAISO prices reflect SP15 hub real-time prices. 2031 ERCOT forecast based on REsurety Weather-Smart system Q2-2023 release, Baseline scenario, averaged across all weather conditions. X-axis shows “hour-beginning” time. Capture rates reflect modeled hourly ISO-average generation profiles. Solar penetration reflects the combination of grid-scale and behind-the-meter solar generation.
Increasing solar penetration also has an impact on the carbon abatement value of clean energy. In the LMP duck curve, daytime solar output drives low or zero marginal cost resources to the margin, reducing power prices. But in addition to low costs, these now-marginal resources often also have low or zero emissions rates3. Under these conditions, additional clean energy during daytime hours may have less carbon abatement value compared with clean energy produced at other times and locations.
In other words, markets with high solar penetration will likely display a Locational Marginal Emissions rate (LME) duck curve in addition to the familiar LMP duck curve. LMEs reflect carbon abatement value at each location in a power system in each hour in the same way that LMPs reflect economic value4. We can use LMEs to measure the decarbonization effectiveness of clean generation resources. Similar to capture rate, decarbonization effectiveness quantifies the realized carbon reductions as a percentage of the potential decarbonization possible with a clean generation resource with a flat output profile.
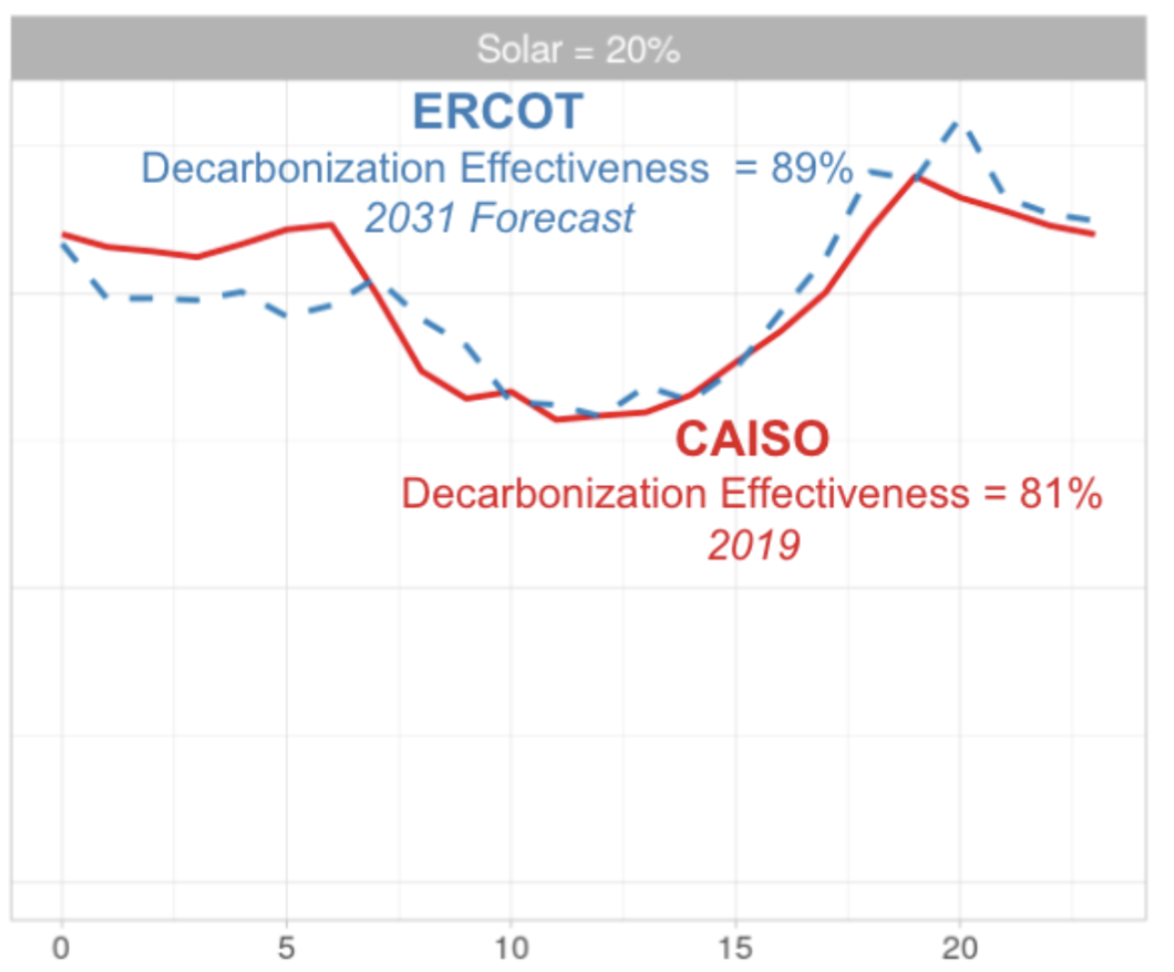
Figure 2 compares the LME duck curve in ERCOT and CAISO as solar penetration increases. As with LMP, the LME duck curve is not noticeable when solar penetrations are low and decarbonization effectiveness of solar resources is high – close to 100% in ERCOT. As solar penetration increases, the LME duck curve emerges and solar decarbonization effectiveness drops. In CAISO in 2019 when solar penetration was 20%, solar was only 81% effective at reducing carbon emissions. Our Weather-Smart LME forecasts show that when ERCOT reaches that penetration, solar carbon abatement effectiveness will similarly fall to 89%.
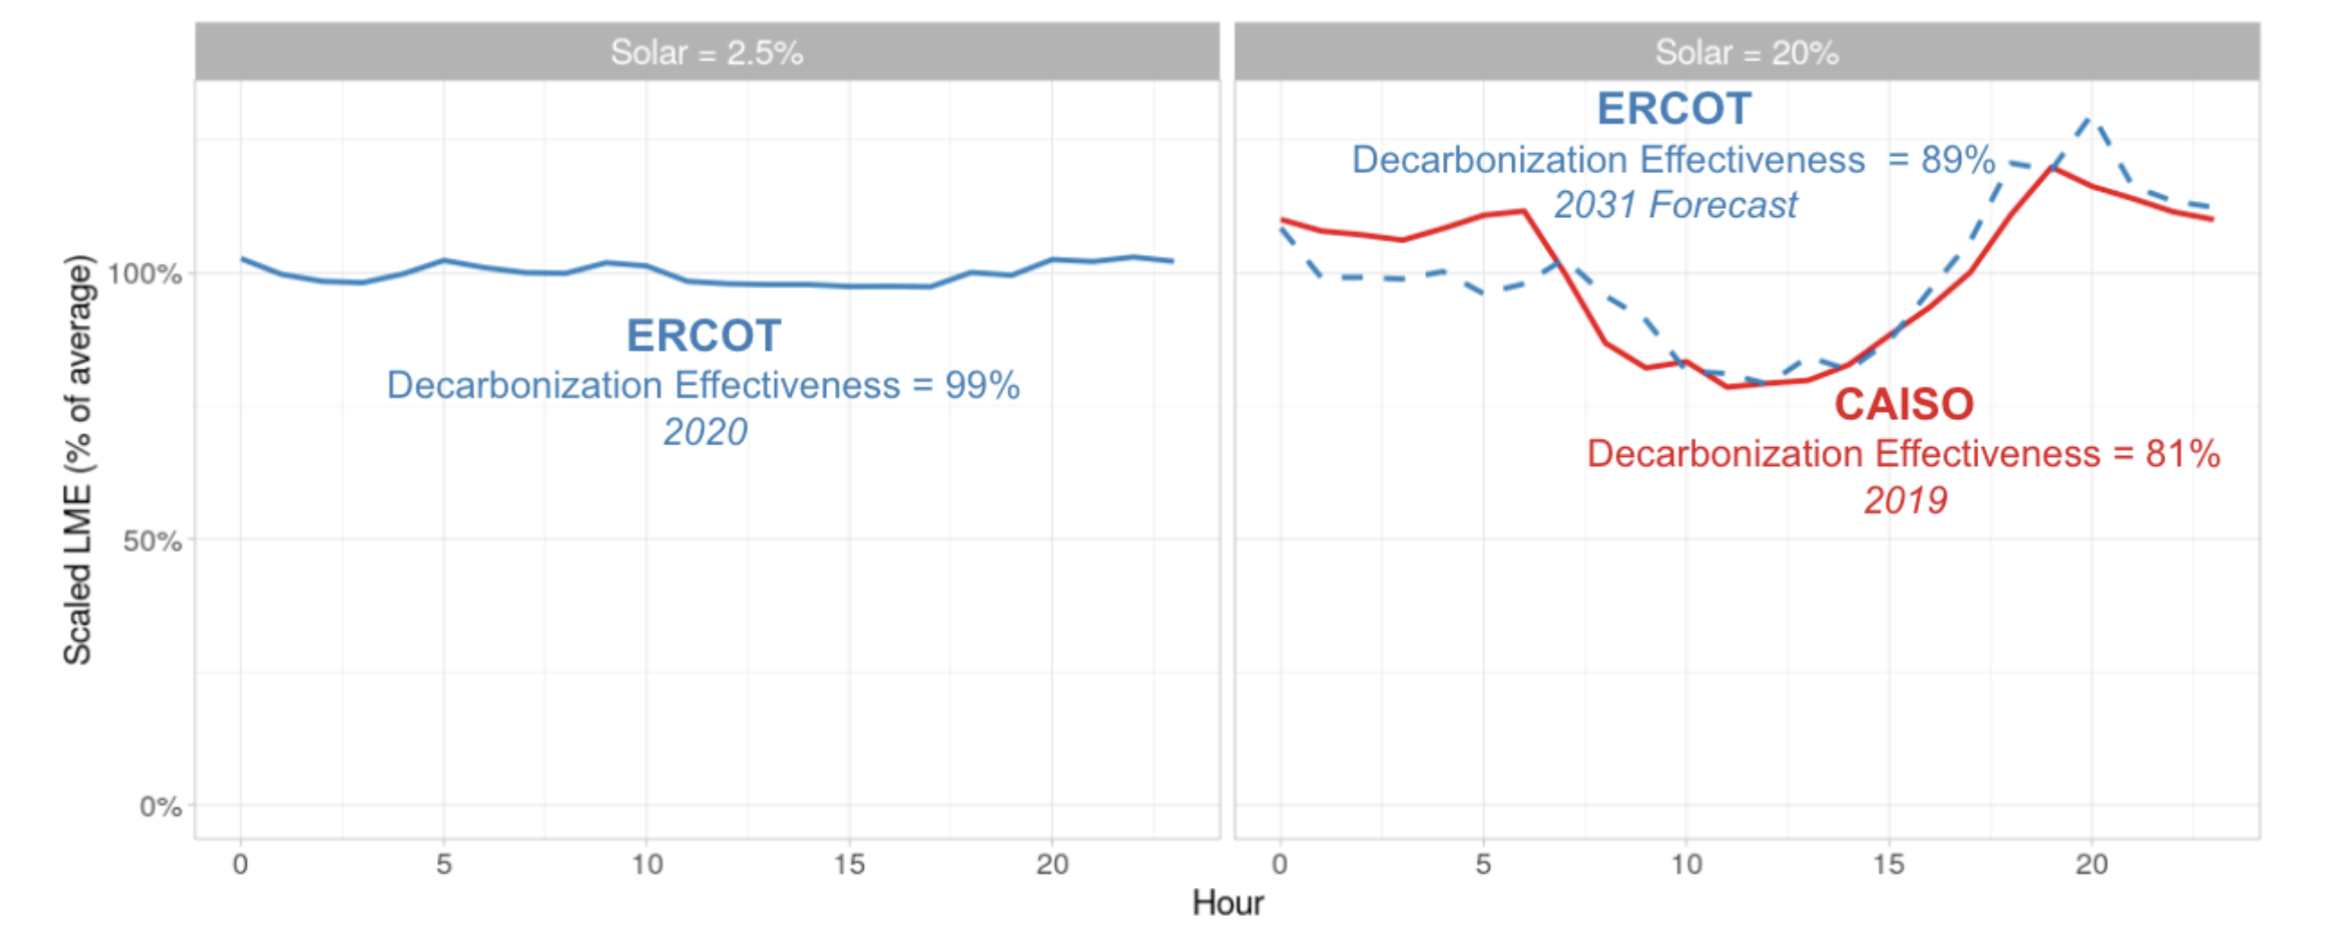
Notes: Y-axis represents the average LME for each local-time hour divided by the annual average LME. ERCOT LMEs reflect North hub and CAISO LMEs reflect SP15 hub. 2031 ERCOT forecast based on REsurety Weather-Smart system Q2-2023 release, Baseline scenario, averaged across all weather conditions. X-axis shows “hour-beginning” time. Decarbonization effectiveness reflects modeled hourly ISO-average generation profiles. Solar penetration reflects the combination of grid-scale and behind-the-meter solar generation. LME data not available in CAISO for low solar penetration.
Financial and carbon abatement value are often the most important motivators for developing a new clean energy asset. Understanding how both value drivers are expected to evolve over time and across markets should be a key component of any investment decision. In practice, every asset is unique, with its own generation characteristics, network location, and contractual details. REsurety’s products and services are supported by decades of granular weather and market data as well as our proprietary Weather-Smart forecasting system and are well suited to addressing this complexity. These tools can help our customers to make better investment decisions, track the performance of their assets, and ultimately achieve more decarbonization at lower cost.
1 Solar penetration refers to the proportion of the total demand for electricity met by solar generation and is often reported on an annual basis.
2 Locational Marginal Price. Represents the financial value of power at a particular location at a particular time.
3 Daytime curtailment of solar resources is one of the drivers of low daytime prices and low marginal emissions intensities in the current CAISO market. Similar effects are reflected in our forecasts for ERCOT.
4 See https://resurety.com/solutions/locational-marginal-emissions/ for additional background on Locational Marginal Emissions.
About the author
David Luke Oates co-leads REsurety’s Research team. His team builds, tests, and deploys fundamentals and statistical models of electricity prices and emissions to support customer workflows. David Luke has over a decade of experience working in the electric power sector from positions in academia, consulting, and technology. Before joining REsurety, he was a consultant at The Brattle Group, supporting electricity market operators, utilities, and asset owners to address market design, asset valuation, and regulatory questions.
Dr. Oates holds a Ph.D. in Engineering and Public Policy from Carnegie Mellon University and a Bachelor’s degree in Engineering Physics from Queen’s University, Canada.
Return to the blog post main menu.