Tara Bartley: Thank you everyone for joining us today. My name is Tara Bartley and I am pleased to introduce Carl Ostridge. He is our SVP of analytics here at REsurety. We recently published our Q4 2023 State of the Renewables Energy Market report. And Carl is here today to share some of the findings, insight, and to answer questions that you might have. Please submit your questions via the Q&A function online and Carl will address your questions at the conclusion of his presentation. I’ll turn it over to you, Carl.
Carl Ostridge: Okay, thanks, Tara. Yeah, this is the first time that we’ve added a webinar onto one of these quarterly reports. So I’m excited that we’re able to add this format to the content as well. So we’ll start with a quick introduction for those who aren’t familiar with the reports. We can give some background there, as well as what we’re trying to achieve with the webinar. Then we’ve got two main topics for the rest of the time. The first is covering the content that’s in the Editor’s Note of the most recent report, and that’s related to the variation that we see in marginal emissions rates for renewable energy projects across the country and some of the implications associated with that. And then the second topic is looking at some other data and some other trends, specifically related to generation and value for wind and solar projects and digging into that in a little bit more detail. Then, as Tara mentioned, we’ll wrap up with some Q&A so please do submit those questions as we’re going through, and we’ll do our best to answer as many of those as we can.
So just a bit of background on the market reports. We’ve been generating these and publishing them for around a year and a half now as a market report. And then we’ve just now added this additional webinar format. And we create these each quarter to provide our customers with data driven insights into value and emerging trends that we’re seeing in renewable energy across the U.S. footprint and in the different ISOs. And we’ve got a team here of experts in power markets, and atmospheric science, and renewable energy offtake to be able to analyze all of the data that we have, and that covers thousands of different locations. All of the analysis that we present here is based on hourly data of price and generation and emissions. And we aggregate that all up and we try to present some insightful and useful content in the reports, and now in these webinars too.
So jumping in to the content here. Like I said, this first topic is covered in the Editor’s Note of the report, and this is related to trends that we’re seeing and variation that we see in marginal emissions data across the country.
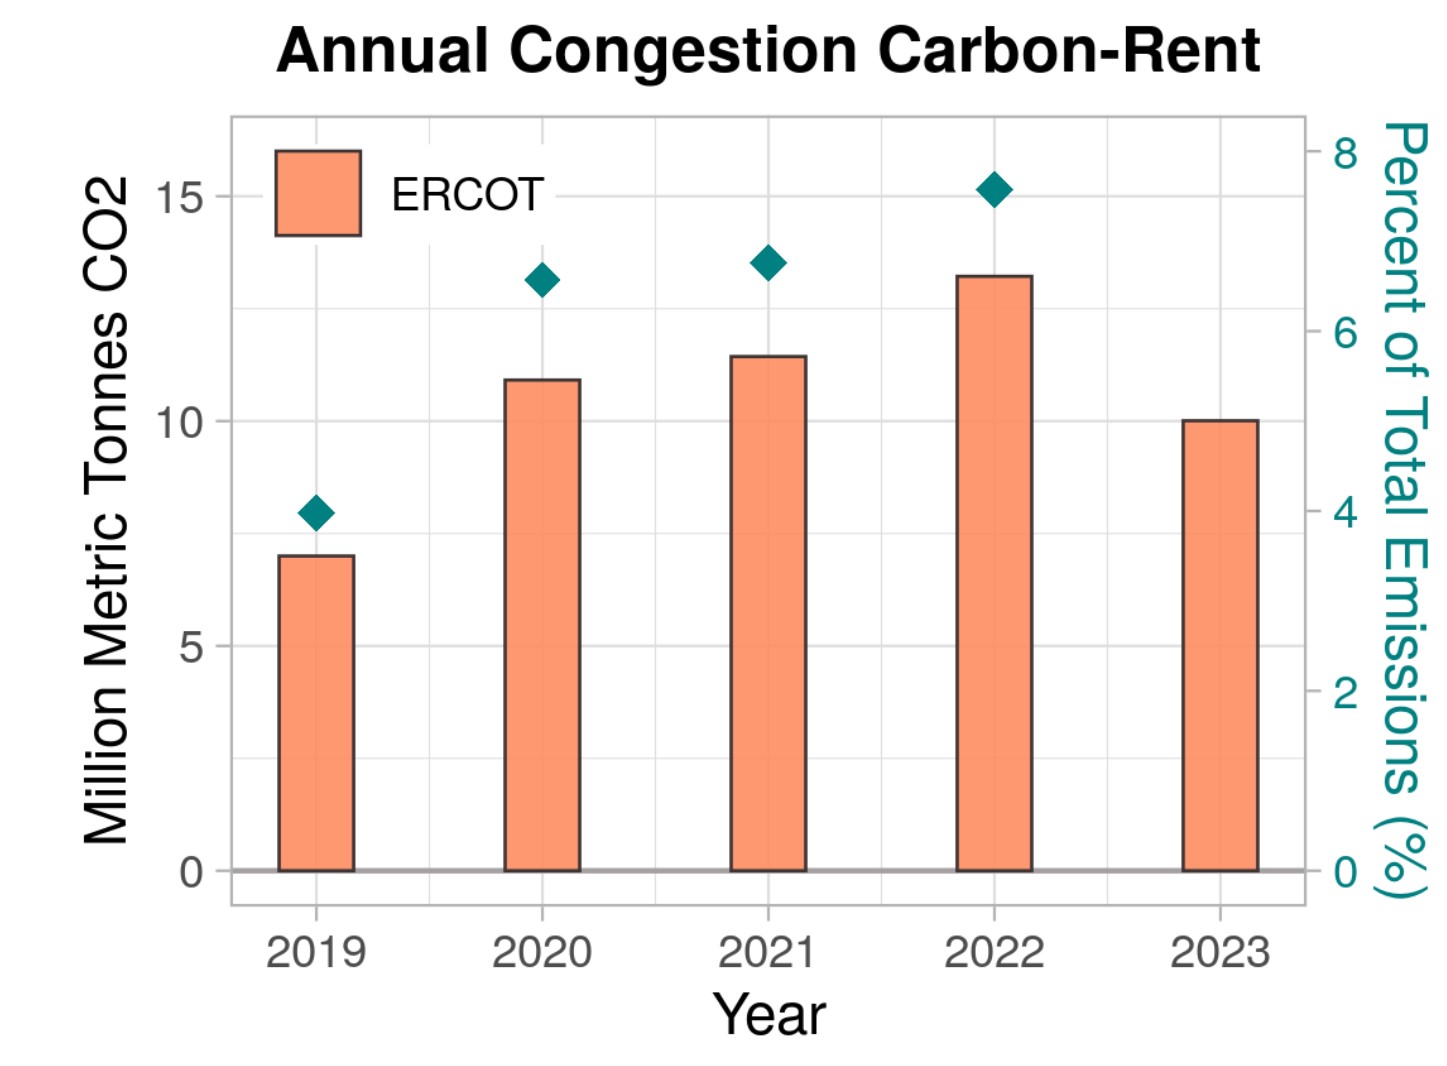
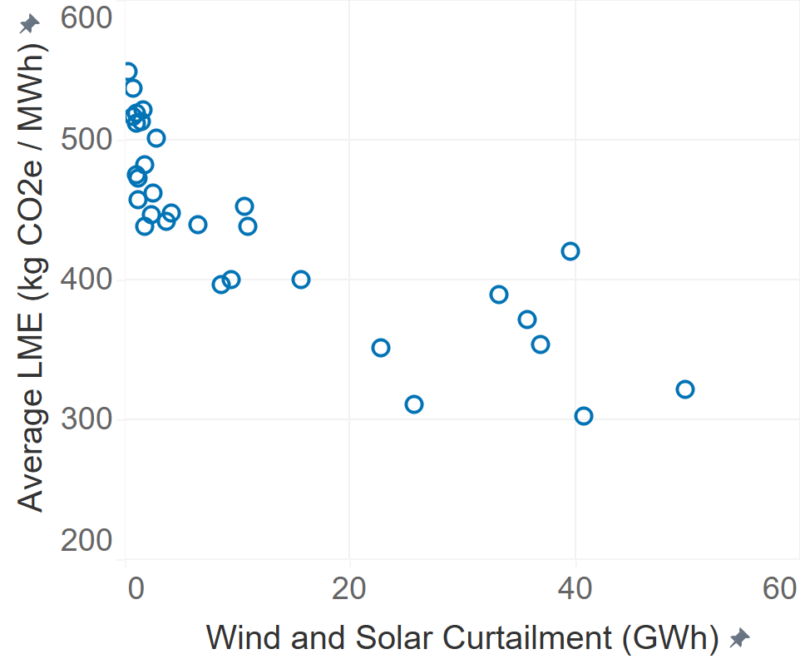
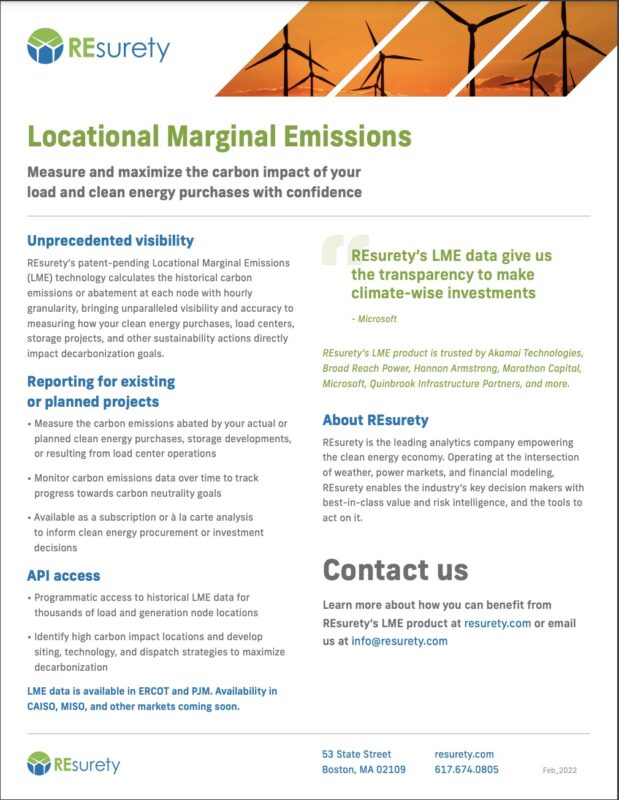
We recently were able to complete the coverage of the U.S. for this data set. And so now we have coverage across the country in all of the deregulated ISOs. And so we wanted to summarize what we’re seeing in the data there and highlight some implications. Before we get too deep into the analysis though, I wanted to start with just a bit of background on Locational Marginal Emissions. This is the data set that we’re going to be looking at here. What is that, and how should we think about it? So one of the ways that I find useful to think about Locational Marginal Emissions is that it’s analogous to Locational Marginal Prices, which I expect that most people are familiar with already. So in each hour or each time period, and in each location on the grid, there is a Locational Marginal Emissions rate and that indicates the emissions in CO2 equivalent for the marginal generator during that time in that location. So it varies by time and it varies by location. But it gives you a sense of the emissions that are avoided by adding incremental renewable energy generation in each location at each time. That means that it can be used as an indication and a metric around the carbon impact that those projects have. The other thing to say is that it’s not a REsurety-specific concept. This is an idea that’s supported by multiple parties. There are different marginal emissions data sources available. We highlight some of them here on this slide. PJM publish, as an ISO, their own marginal emissions data for their particular footprint. Our data set, as I mentioned before, now covers the entire U.S. deregulated ISOs and there’s a nodal granularity, but there are also other publishers out there as well.
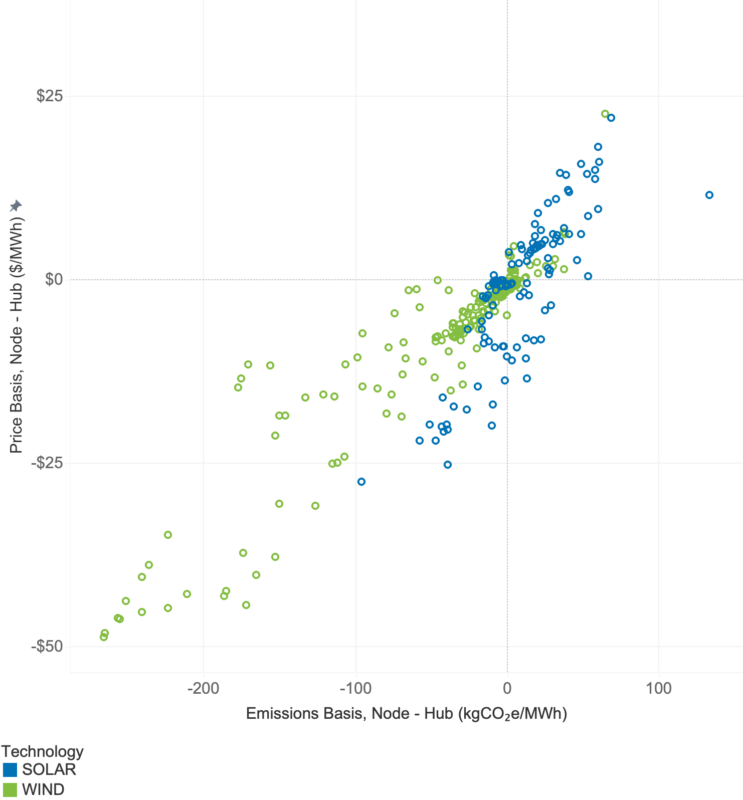
So on the next slide, we have a couple of examples here to step through that will hopefully solidify an understanding of what we mean by Locational Marginal Emissions and how to think about it with respect to renewable energy projects. So we have this first example, this is for a wind project in central Texas and we have three different charts here. The one on the top represents the generation from the project. I think we have a few weeks of time period covered here. The middle one is the prices, the Locational Marginal Prices, at the project location, and on the bottom we have the Locational Marginal Emissions. And this is a project in a location that isn’t subject to meaningful transmission constraints. I guess that’s an important thing to say, is that the marginal emissions rate is affected by and driven by, in many cases, the transmission congestion and constraints that may exist in each different location. The example we have here, there’s no meaningful transmission constraints. And so what you see is, even as the project generation fluctuates from close to full capacity down to very little output on different days, the marginal emissions rate stays fairly constant and the marginal prices, yes, they go up and down, but there isn’t a strong correlation between project output and the prices.
If we go to the next slide, we see a different scenario. On this one, we see a project that is in a location with meaningful transmission constraints. Now we’re looking at a project on the Gulf Coast of Texas, south of Houston, and this is a region where there are a lot of wind farms and transmission constraints, meaning that when it’s windy, not all of that wind power can reach the load center. And that means that at times, projects might be curtailed. And also that wind can be the marginal fuel in that particular grid region at those times. We see that in the data here. So during this highlighted period in the middle, we see when the project output is high, the nodal prices are now dropping down during that period compared to the hub prices, which is the yellow line behind. And then you can also see multiple periods where the Locational Marginal Emissions rate is dropping too, and dropping down to zero. And that indicates periods where the marginal unit, the marginal generator in this local region, is wind. So hopefully that’s a useful way to explain Locational Marginal Emissions and how to think about it in the context of renewable energy generation and what might drive higher or lower marginal emissions rates and emissions impacts for different projects.
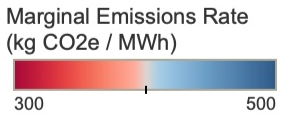
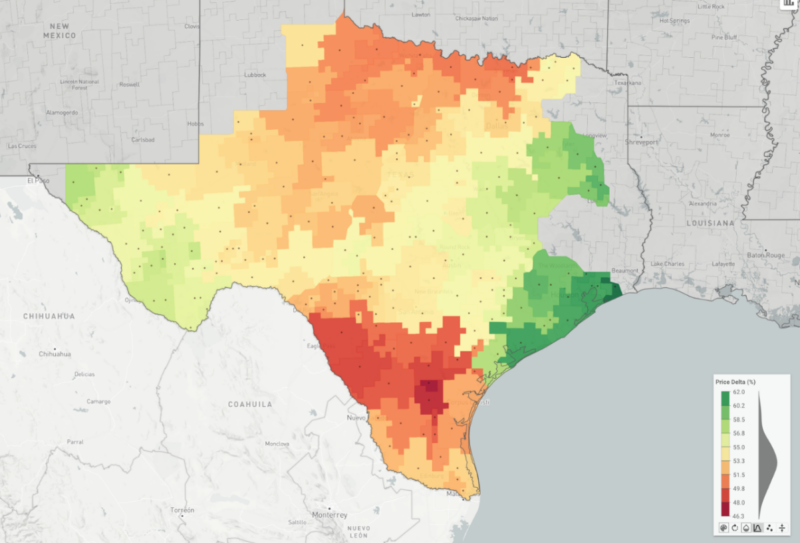
On the next slide here we have a map that was taken from the report. So this is just a nice visualization of all of that data that we have. Each of the points here represents a wind or a solar project that’s operational. And we’ve calculated the generation-weighted emissions rates. So effectively its emissions impact during this 12-month period. And there are lots of different insights that you can see immediately from this map. There’s different regional variation, there’s also projects that sit very close to one another that seem to have quite different emissions impacts. And so we’ll dig into that in the next couple of slides.
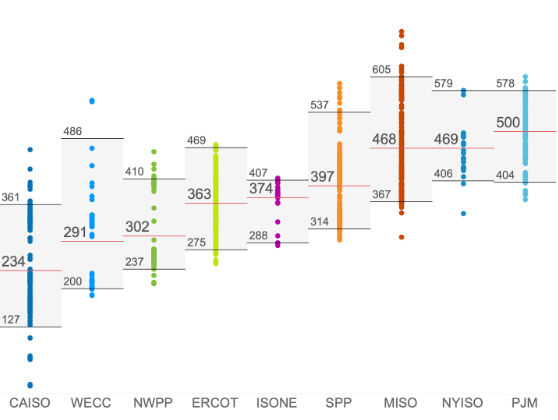
This chart now is really just taking that same data from the previous slide and presenting it in a slightly different way. Each point on this chart is still a renewable energy project – wind or solar- and we’ve just grouped them by ISOs. We’ve also stacked up those ISOs in order of emissions impact, with the lowest on the left and the highest on the right, from an average perspective. The boxes that are included for each of these charts, the middle line is the average value of all those projects, and then the top 5% and the bottom 5% values are also included. So there’s a few takeaways here that I want to highlight. The first is that renewable energy projects in CAISO have the lowest emissions impact out of all the projects that we’re looking at here, on average. And that sort of makes sense from an intuitive perspective. CAISO is a grid that has lots of renewable energy already, particularly solar, and so in many areas of that footprint, adding more solar means that you’re often competing with existing solar and therefore not having as much of an emissions impact in terms of displacing thermal generators on the grid. But it’s worth noting the magnitude of the difference. The average in CAISO is less than half of the average impact across a number of other ISOs like MISO, NYISO, and PJM. And even the top 5% of projects in California in that CAISO footprint are displacing less CO2 equivalent than average projects in lots of other ISOs. On the other end of the spectrum, we have PJM. So that’s where the renewable energy projects are having the largest impact. And, again, that makes some sense from an intuitive perspective. PJM is a big market with lots of load and relatively low renewable energy penetration rates and it also has a relatively dirty generator stack compared to some other markets. And so that combination means that incremental wind or solar additions in that grid have a relatively large impact compared to other regions. The final point that I want to highlight here is, yes, there’s lots of variation across the ISOs and between them, but there’s also lots of variation within them. And you look, there’s lots of overlap in the project-specific emissions impact numbers within and across the ISOs. So there’s two things really driving that. One relatively small factor in most markets is technology. So in markets where there’s already a lot of wind or solar installed, the opposite technology tends to have more of an impact and that’s due to the offsetting anti-correlated generation profiles, generally speaking, between wind and solar projects. And that adds some variation. There’s a bigger driver, and we’ll touch on this in the next couple of slides, which is down to transmission. And so within each ISO, there can be meaningful differences and constraints imposed by transmission and that introduces a big difference in the impact that each project can have.
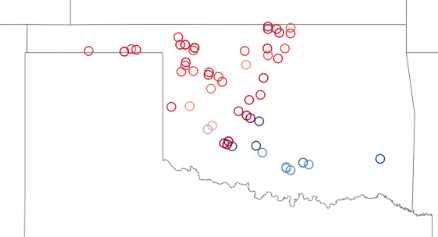
So on this slide, we have an example where we’re zooming in just to one part of that bigger map. So we’re looking at SPP projects and specifically wind. So now we’re removing any technology drivers here that might exist. So just wind projects in SPP, and we’re looking just in the Oklahoma footprint here, just for simplicity. And it’s pretty clear here that there’s a big difference in the relative emissions impact between projects located in the west of that state’s footprint versus the few projects that exist in the south and further east. And that’s being driven by transmission. So all those projects to the west that have lower values, those more red colors in this particular plot, that means that they’re competing with other renewable energy generators more often. And when it’s windy, is the same effect that we were looking at in that earlier example from ERCOT. Curtailment is often happening, and wind is more often the marginal generator in that particular region. Those projects to the south are not constrained by that same transmission issue, and therefore able to more often displace thermal generators on the grid.
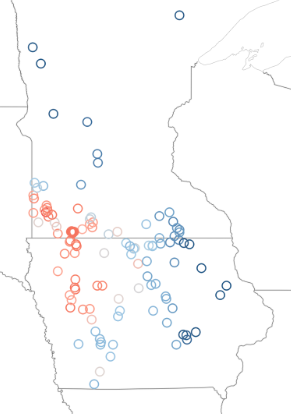
The next slide has another similar example but just from a different part of the country. Again, we’re just looking at wind projects here and now in the MISO footprints. These are MISO projects, wind across Iowa and Minnesota. And again, we see this little pocket of red projects that are having a lower emissions impact compared to projects further east that are having a higher emissions impact. And again, it’s the same transmission driver that we were seeing on the previous example as well.
Okay, so just to wrap it up there is one important implication that we wanted to touch on on the next slide. And this is related to a lot of the discussion and debate happening around clean hydrogen tax guidance and the tax credits. So the current guidance from IRS is that an hourly matching framework will be implemented, and that the renewable energy procurement, under the hourly matching regime, will need to come from within the same region as the electrolyzer. Those regions don’t perfectly line up with ISOs but they’re close enough for the purposes of this analysis and this example. And, again, this variation within the ISOs is important, and what that means when we think about the real world implications for this hourly matching framework. There could be a big difference if the electrolyzer is procuring the renewable energy from one project that maybe is having a lower emissions impact, or from another which is having a much higher emissions impact. And so it’ll be interesting to see how that debate and how that process unfolds as we go forward, but this data provides some insight into how those different projects will, in the real world, behave differently.
Okay, so moving on to the second part of the presentation. Just picking out some of the important trends that we’re seeing in the data in a more general sense across a few different markets.
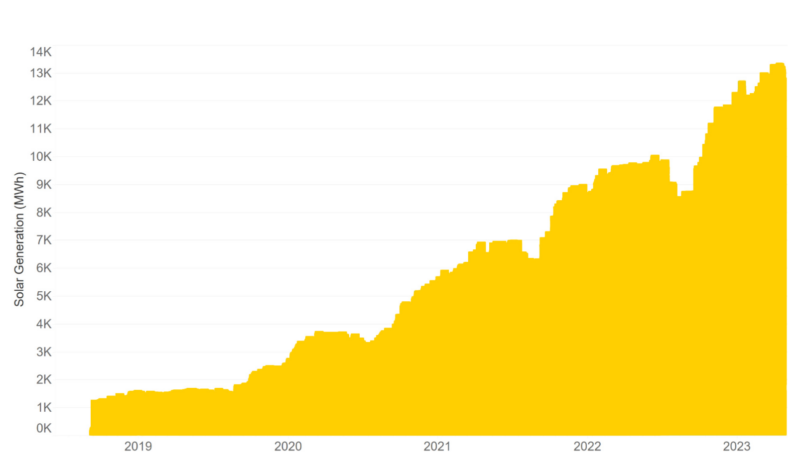
The first thing that it’s almost impossible not to talk about, is the level of solar build out that’s continuing to happen in ERCOT. This chart speaks for itself. Over the last five years, ERCOT has added a bit shy of 14 gigawatts of solar. And it’s added that at a rate of about three and a half gigawatts a year for the last few years. And that’s showing no signs of slowing down. There was a big jump at the start of this year, and so they reached a new record of 15.1 gigawatts of maximum output within the last week or so. And that’s having a big impact on price formation, the fundamentals of the market, but also solar value in ERCOT, and we’ll touch on that over the next few slides as well.
So the next couple of slides, the text here is small, these are lifted from the reports, you can zoom in and look at the specific values in the report itself. The color scheme doesn’t really portray it here, because there’s a lot more dynamic range that we’re not showing in these zoomed in views, but wind, which we’re showing here, and also solar value on the next slide, we’re down 30 to 50%, year over year, Q4 2023 versus Q4 2022. So we’re going to just dive into that in a little bit more detail and see what some of the drivers are there. So this is wind. The next slide shows a similar story for solar. So yeah, we’ll dig into some of the drivers now on the next slide.
So just starting from the simplest view, looking at the average prices, we say ATC here (around the clock), it’s just the simple average of power prices in just a select number of markets here to keep it simple. We’re looking at CAISO, ERCOT, PJM, and SPP. We see that again, somewhere in the same order of magnitude 30 to 50ish percent was the decline in average prices. And so that starts to give you an indication that that’s a big driver behind that drop.
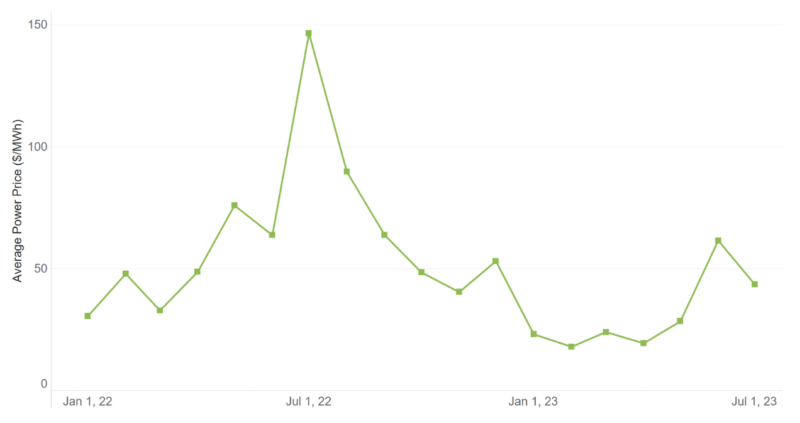
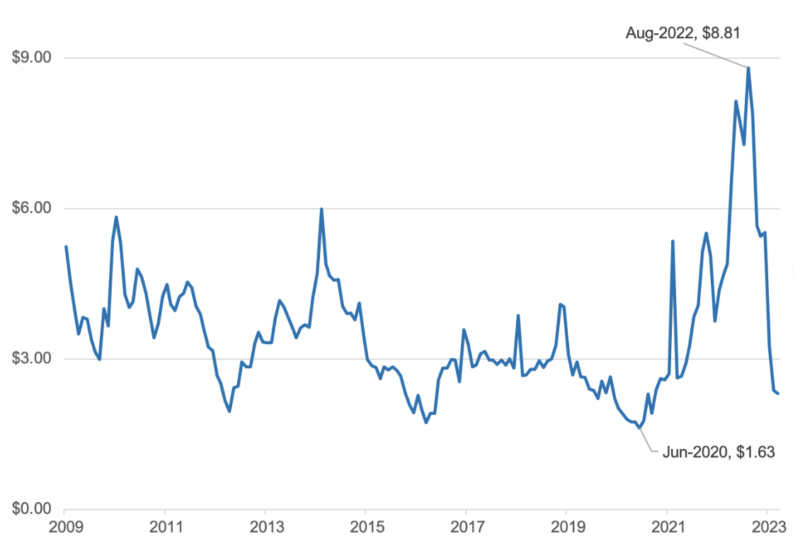
On the next slide, we add in gas prices. So that’s always the first place that I go to when I see a big drop in average prices. It’s probably being driven by natural gas. And we see that’s certainly the case here. Similar magnitude of drop in Henry Hub, in this case, natural gas prices year over year. There was a big run up in natural gas prices in 2022. And then some milder weather and some at least settling into a status quo, geopolitical issues meant that those gas prices have started to come down and that’s had an impact on power prices too.
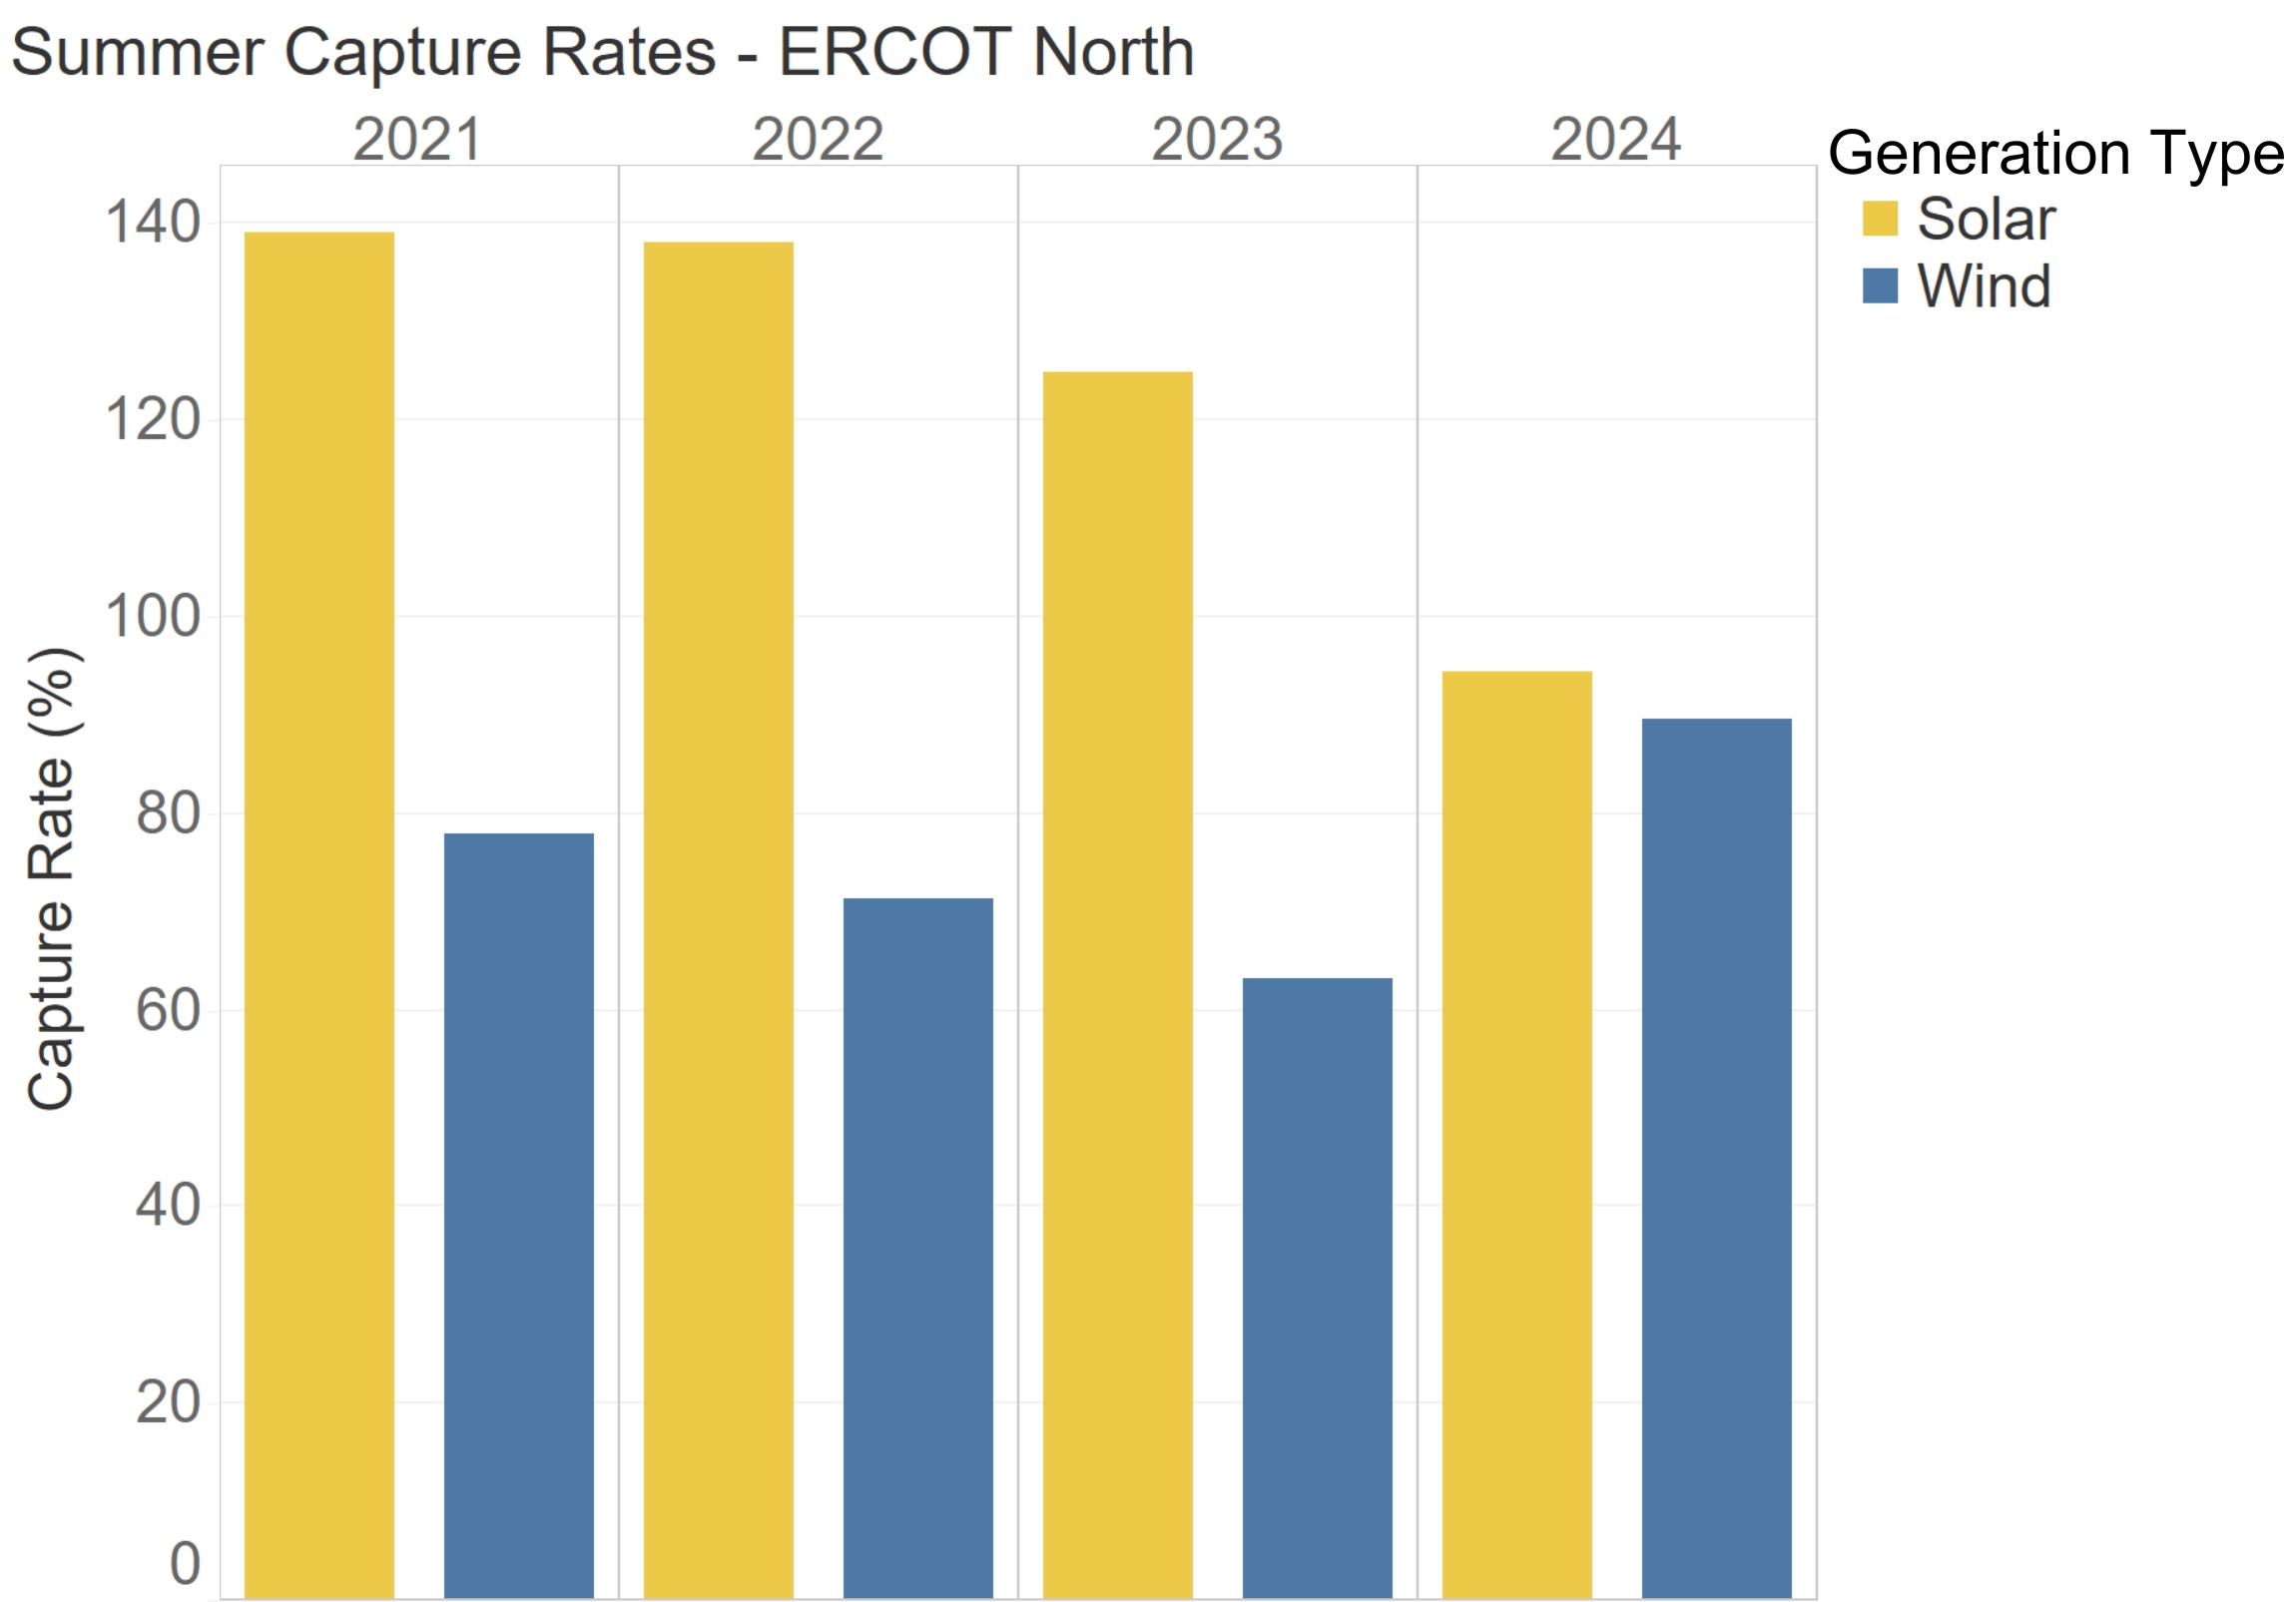
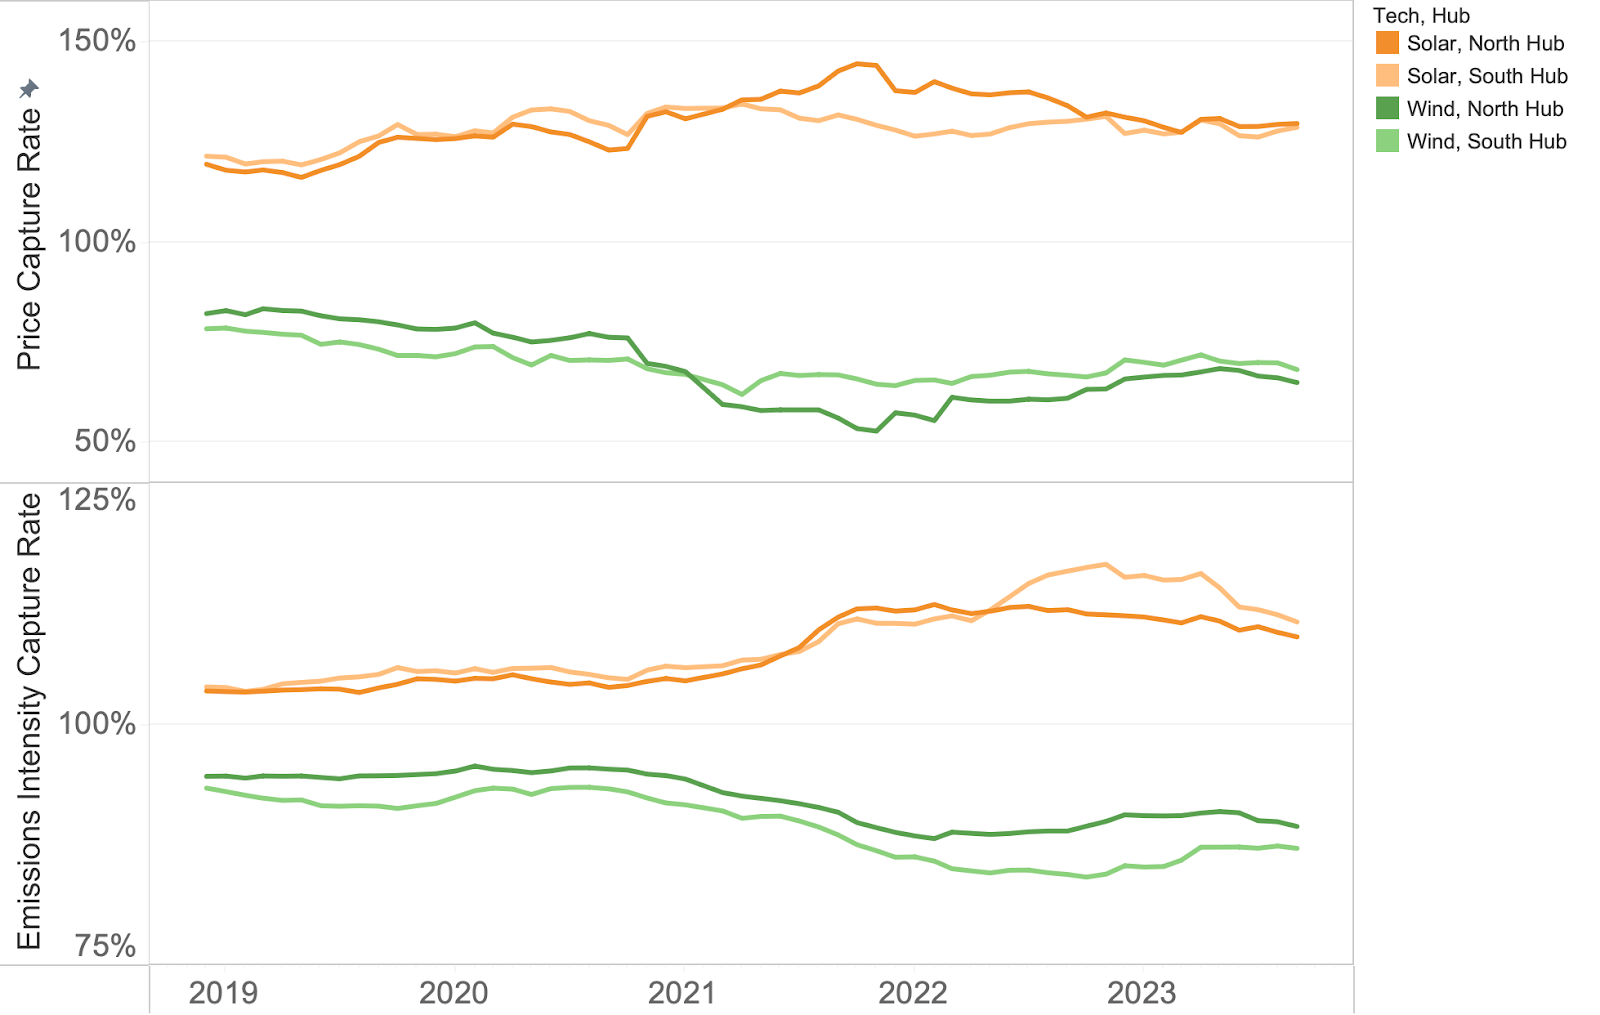
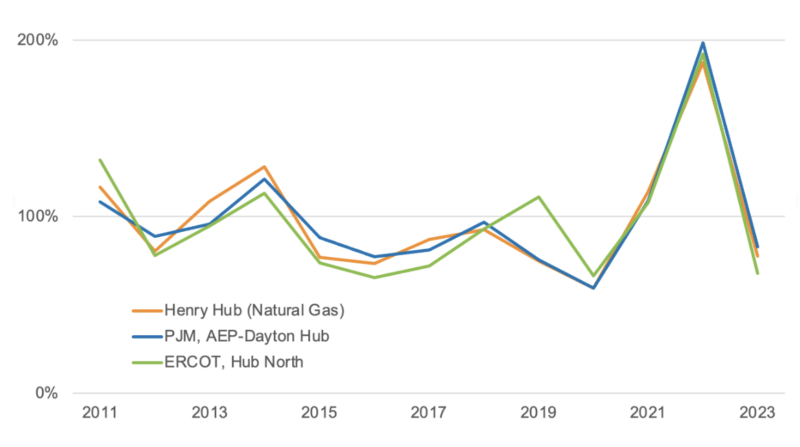
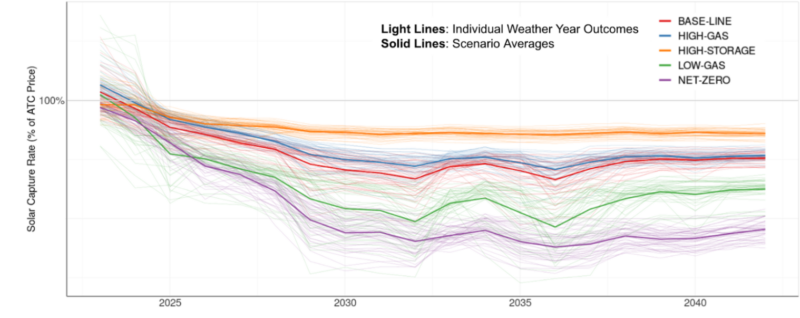
So on the next slide one other thing that we always look at here is capture rates. So this is the ratio of the generation-weighted value over that simple average value. And it gives you a sense o,f for wind or solar projects, how much of that average value were they able to capture? And there’s a few things that jump out here. We’ve plotted out, so you can see kind of a year over year comparison across the different quarters. The ERCOT line, you see generally there’s a pretty strong downward trend, with a couple of exceptions. The Q3 results was definitely a point that bucks the trend and actually increased in 2023, compared to the year before. And that was driven by a lot of the heat and the extreme weather during the summer. And then the high prices and the volatility that followed. Q4, on the other hand, we saw a big drop year over year, and there’s been a relatively mild winter so far, and that’s definitely contributing to part of that as well, sort of returning to that downward trend.
On the next slide, this is now looking at wind capture rates. And the first thing that I noticed when I look at this is that the trends are much flatter, much more stable compared to those solar capture rates, at least in the markets we’re looking at here. And you can also start to see maybe some indications that the capture rates might be moving up in some places, particularly ERCOT West. Q4, the capture rate moved up year over year, and this is something that we expect to see. It’s not a really strong trend in the observed data yet, but as that solar build out increases, we expect the market and the prices that are now responding to that increased solar build out, it’s going to move some of the higher priced hours out further later in the day into hours that generally have higher wind generation levels. And so we expect some upward movement in wind capture rates over time as that solar build out increases. I highlighted one of the points here for PJM, and we’ll cover that actually on the next slide.
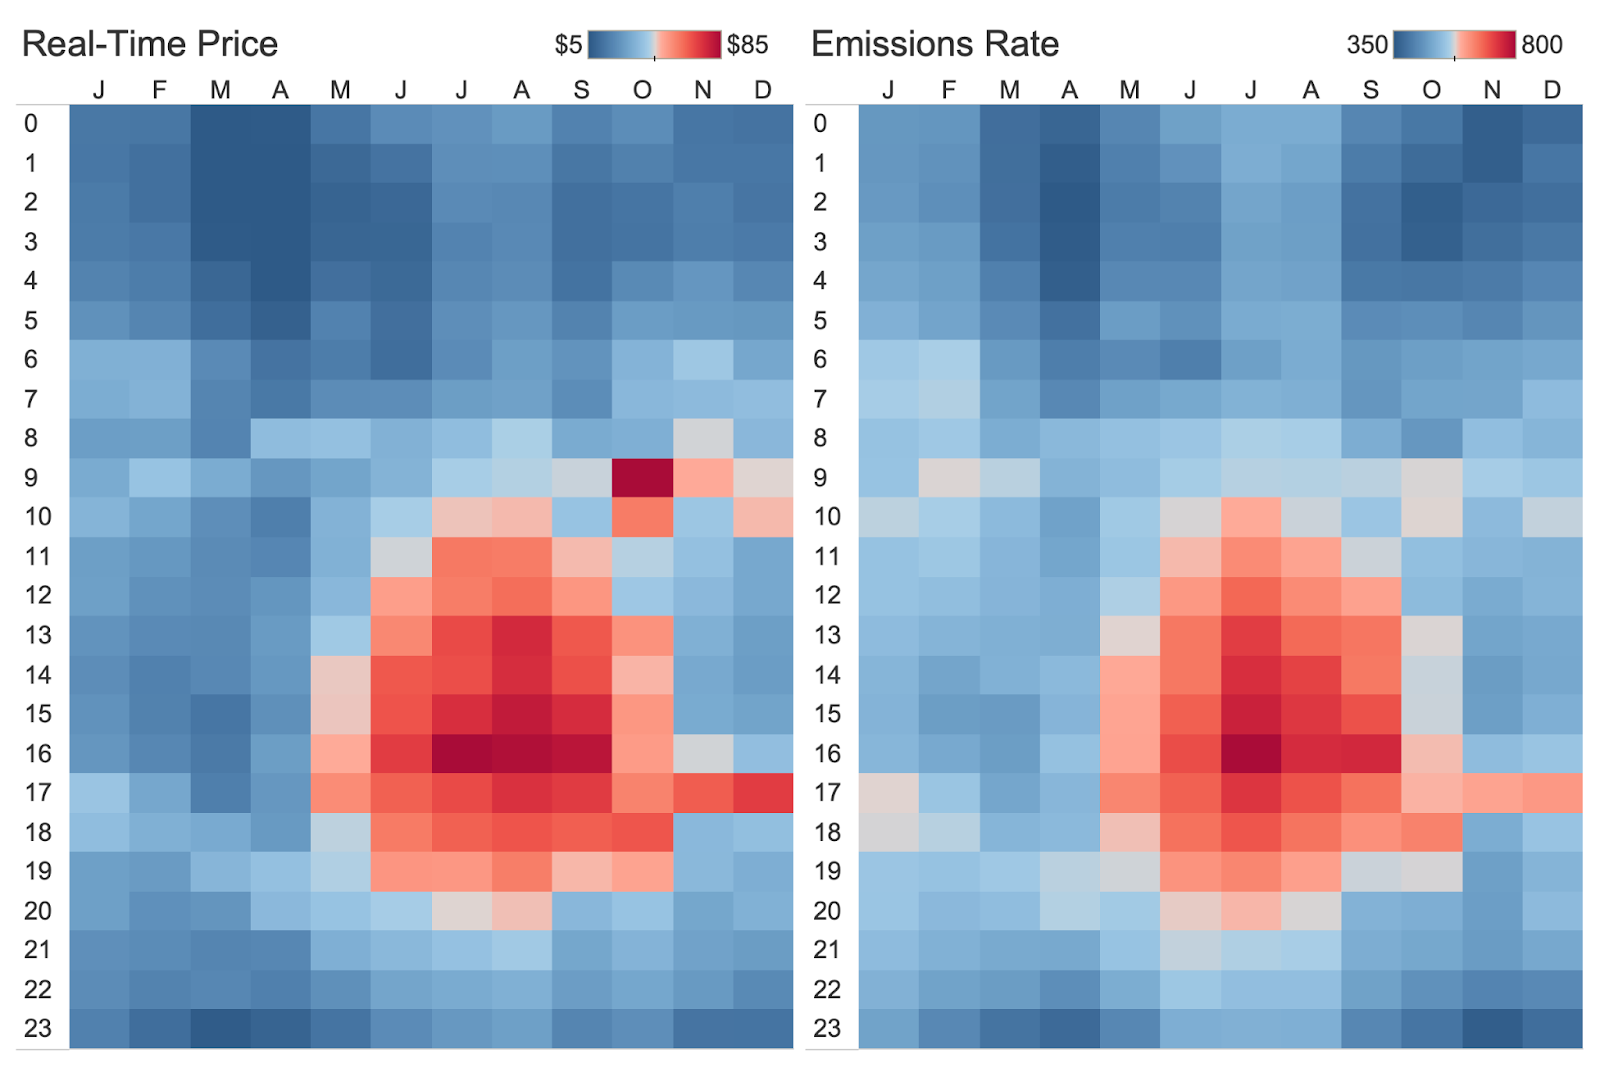
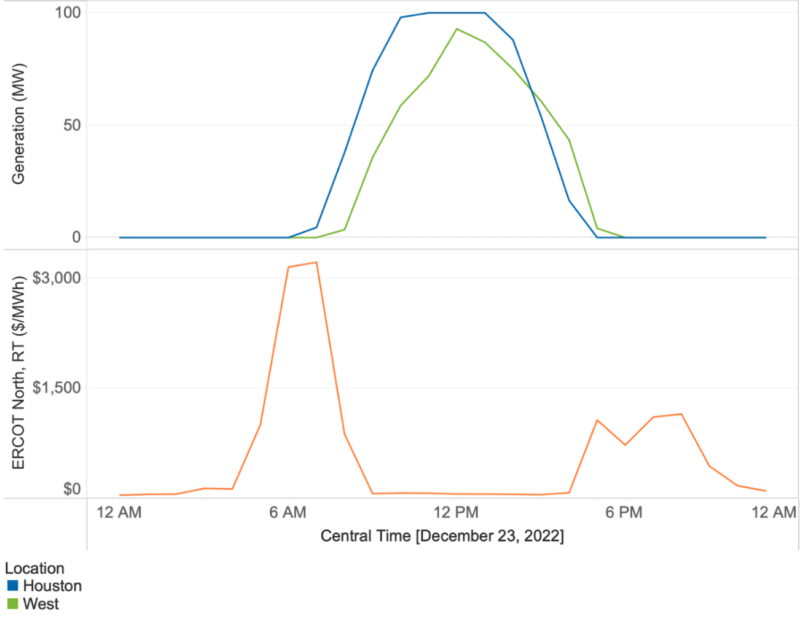
And so there was this very high wind capture rate in Q4 2022 and a much lower value in 2023. And actually, this just points to really having to dig into the hourly data to understand what’s going on. And this is December, 2022 prices real-time from CAISO, ERCOT, and PJM. And you can see that there were different reasons in these markets, why they had high prices. California is the dark blue line there, and you see that, generally speaking, the prices were just high all month. And so that decrease year over year, in average prices was being mostly driven by gas or higher gas prices on the west coast compared to other parts of the country. And that since eased somewhat, and it’s brought the prices down. ERCOT and PJM are a different story. They had relatively normal prices through most of the month. And then there was a weather event and the storm that passed over those regions around the Christmas periods, so towards the end of the month, and you see those high prices that resulted. That obviously drove up the average and also drove up the wind capture rates as well as some solar capture rates as well. So you really do need to understand the hourly data in order to really understand some of the drivers. But just to summarize, I suppose there were three drivers of that drop in wind and solar value. Gas prices dropped by around 50%. There was some weather-driven volatility that we’re addressing here. And then in markets like ERCOT, the changing grid mix, and the continued solar build out is also having an impact too.
So I think that’s all the slides that we have. I see Tara just added a reminder there to submit questions through the form. We have some already coming in. But please do add more as things come to mind. And we’ll jump into Q&A starting now.
Tara: Thank you very much Carl. That was a lot of information and you timed it perfectly. It’s exactly 25 minutes, so we’ll give you a brief break to maybe grab a sip of water. So yes, please submit your questions online. The first one that we always get is: will we get a copy of the presentation? We are recording this session, so we will send you a link to the recording by the end of the day tomorrow. And be sure to let your colleagues know if they weren’t able to attend a live session, they will also receive a copy of the recording.
So the first here is a comment where one viewer says, “I really liked the report, especially where you point out the attractiveness of PJM for renewable projects in comparison with CAISO.” So the first question here is, “How are you seeing customers use your LME data as part of their procurement strategy?”
Carl: Yeah, and there’s definitely a link that we can draw between the comment and the question there. So certainly what we’ve seen, I think there’s two ways that people are using LME data. The question specifically asked about procurement process and procurement strategy so I’ll talk about that first. For energy buyers, they’re able to use that data to understand the emissionality – the emissions impact that those projects will have – and for many and an increasing number, that’s an important factor for them when they’re considering their procurement. And they want that emissionality to be a consideration alongside the economics of the transaction. So it allows the extra dimension to factor into the procurement and to maybe help drive decisions. For some, that’s the primary factor – the emissionality. The Emissions First Partnership is a group of corporate buyers who are driving that as their primary goal. There are others who maybe aren’t part of the Emissions First Partnership, but want to also have an eye on emissionality and maybe use that as a tiebreaker when they have two projects that look very similar, but maybe have different emissions impacts. And then maybe the second part of that is on the developer side, we do see developers using the emissions data as a means of differentiating their projects as part of those RFPs. Being able to get ahead of the questions from the buyers and say the data shows that the project in this location has an above average emissions impact can be a differentiating factor during a competitive RFP process.
Tara: Thank you, Carl. The next question is, “It looks as though all of this data is historical, do you have forecasted data as well, and do you produce similar generation-weighted values?”
Carl: Yes, so all of the data in the report and the webinar so far is historical. But it is important to note that we do have forecasted values as well. Those cover price and also marginal emissions rates as well. And so we are able to forecast out 20 years into the future across all of those deregulated ISOs, and we use a fundamentals-based model to forecast hourly prices across a range of different fundamental scenarios. And then importantly as well, we use our Weather-Smart approach, which allows us to maintain that correlation between the weather, renewable energy generation, and market prices to really give a full range of possible outcomes within those forecasts as well.
Tara: Thank you. The next one is, “How might you consider a portfolio of different projects or technologies for calculating electrolyzer utilization under an hourly matching framework?”
Carl: Yeah, so this is a really good question. And we’ve been working with a number of hydrogen developers on this exact question. And when you’re thinking about an hourly matching framework, the goal for a hydrogen electrolyzer is to try and get as close to constant offset between renewable energy and their consumption and to try and keep that utilization rate for the electrolyzer as high as possible. And so all the hourly data that we have, we have in our Explorer product. We have synthetic projects covering the entire country, we have full modeled hourly generation data for almost all operational projects in the country as well. And so we’re able to combine those, do some analysis on optimization to try and find the right mix of wind and solar generation to maximize that utilization rate of the electrolyzer as well.
Tara: Thank you. The next one is, “You showed wind and solar As-Gen prices declining year over year. Do you expect that to continue? Why or why not?”
Carl: Yeah, so that’s a good question. I think it’s obviously market specific. I suspect the question here is related to some of the content that we had in ERCOT. So, yes, I think our expectation based on that fundamentals modeling that I was talking about earlier, is that at least the capture rates, the relative value of solar compared to the average prices, we expect that to continue declining as more solar is added to the grid because you’re going to see an effect similar to California, where there’s a depression in prices during the middle of the day when solar is generating, and then maybe some increased volatility and increased prices as the morning and evening ramps occur. And that will naturally drive down those solar capture rates. So we do expect that to continue, especially given the rate of increase in solar installations that are happening currently in ERCOT. I guess we should say that we expect maybe the opposite to happen for wind. I mentioned that a few slides ago, but that same effect on prices, we expect to have a positive impact on wind capture rates.
Tara: Okay, I think we’ve got one more here, Carl, and that is, “Beyond implications for 45V green hydrogen, how is marginal emissions data being used by your customers today?”
Carl: Yeah, so we covered some of this earlier in the question around procurement. So we’re definitely seeing that as a big use case, corporate buyers and other buyers looking to understand the emissions impact that their procurement strategy can have. We’re seeing it used by developers to understand how their projects stack up against regional benchmarks from an emissions perspective. And then we work with some storage assets and developers to look at ways to dispatch storage potentially to maximize carbon impact, as well as optimize around prices and the pure economics. So there’s really a number of different ways that that’s being used. Those are some examples that come to the top of my mind right now.
Tara: That’s great. Thank you very much, Carl. It looks like that is all that we have for questions for today, although it was quite a few. Thank you so much for addressing all of those. Here in the chat I just included the link to the Emissions First Partnership that you mentioned, Carl, so folks can take a look there. Again, we’ll send out a recording to this session tomorrow via email, we’ll also include a direct link to the report in case for some reason you haven’t downloaded it yet. Oh, one more question just came in, Carl, can you handle one more?
Carl: I can take one more, yeah.
Tara: All right. “Do you have any predictions for curtailment? Where is it worst? Where will it get worse? And how does curtailment interact with the capture rates?”
Carl: Yeah, so I’m going to try not to give too much of a hand wavy answer to this one because I think if people can predict with lots of certainty where price basis will be bad, or how it will develop in the future, then they’d probably make lots of money if they could predict that perfectly. So we obviously can’t, and that sort of transmission planning and forecasting isn’t our area of expertise. But what I would say is you can look at historical data to understand where those trends have been developing in the recent past. You can also look at interconnection queues to understand if there’s a lot more wind and solar projects expected to be added in a certain location. And that’s obviously what’s driving a lot of this is when you have lots of the same technology type in the same region, and especially if there’s an existing transmission constraints, then transmission just isn’t getting built fast enough for the projects that are being added. And so my assumption there would be that if there’s a lot more projects expected to be built, or with interconnection agreements, then that, all else equal, would cause basis to get worse. So I would not necessarily offer a prediction of the future but encourage an analysis of data in the past and also data that’s available on where projects are being built to inform that.
Tara: Thanks again, Carl. It looks like that wraps it up for our Q&A session here. And on the next slide, you’ll see a couple of options for reaching out to us at [email protected] or to visit our website to learn more. Again, thank you very much, Carl, for sharing all of this data and your insights. And thanks to everyone for joining and this has been a great success. So I might commit Carl to doing this again next quarter if time allows. So look out for emails from us on our next webinar. Thanks, everyone.
Carl: Thanks everyone. Bye.


