What PPA buyers and renewable developers need to know
Published by Factor This
Authored by Divita Bhandari, Senior Research Scientist, REsurety

Senior Research Scientist
The last few years have seen an increasing trend of negative power prices in the region served by the California Independent System Operator (CAISO), particularly in Southern California.
Negative prices in CAISO effectively drive down the average price of power during certain times of day, which has significant implications on the revenue for energy resources, particularly solar and storage. This, in turn, has significant implications for revenue received by any entity that has exposure to wholesale energy prices, such as project developers or Power Purchase Agreement (PPA) buyers.
What Causes Negative Power Prices?
Negative prices are driven by a variety of conditions on the grid that cause an oversupply of generation. The drivers to oversupply include low demand, inflexible thermal generation, substantial renewable generation (e.g., solar and wind), and transmission congestion. Negative prices in any region can be driven by some or all of the above conditions. While CAISO has historically been a market leader in the growth of solar energy, which is the key driver of negative prices in the region, substantial growth in solar builds is now appearing in other markets, such as the Electric Reliability Council of Texas (ERCOT) and the Midcontinent Independent System Operator (MISO). Thus, the negative prices seen in CAISO may be an early indication of how prices in other markets may evolve if solar resource growth continues at its current pace. This article explores the drivers of negative prices in CAISO and the broader implications of these trends.
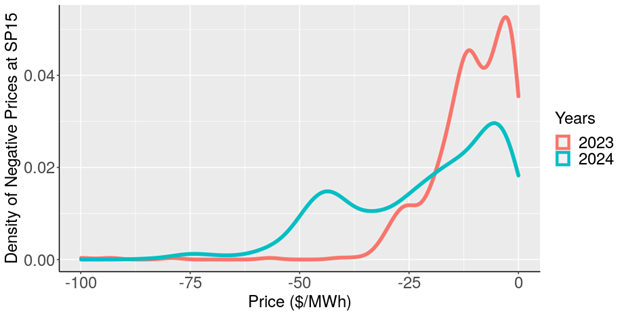
Figure 1 above shows the frequency and magnitude of negative price occurrences in 2023 and 2024 in SP15, the price hub that covers much of Southern California. There were ~1,180 hours in 2024 that had below-zero prices (~13% of total hours throughout the year) compared with ~530 hours in 2023 (~6% of total hours). In addition, the median negative price in 2024 was ~ – $17 compared with ~ – $10 in 2023, indicating that both the frequency and magnitude of negative prices have increased over the last year.
Supply/Demand Balancing and Negative Prices
Generation oversupply during low-demand times primarily drives negative prices. Generation oversupply results from a combination of factors. Conventional generation (e.g., nuclear and certain thermal plants) are largely inflexible in their ability to ramp up and down to meet load. Solar and wind generation fluctuates based on weather conditions and cannot be adjusted to meet load. Transmission bottlenecks also prevent excess generation from being delivered to external regions. As a result, these periods of oversupply typically result in a surplus renewable generation.
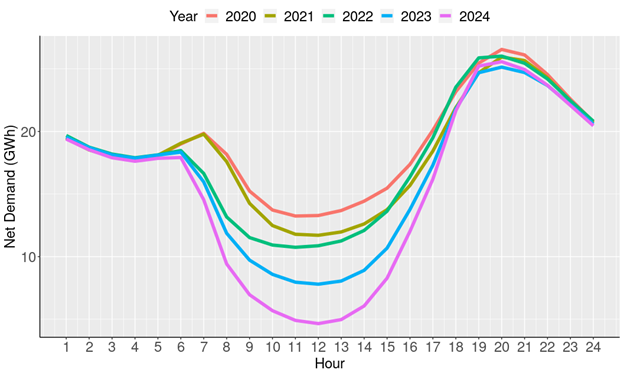
In CAISO alone, utility-scale solar capacity has grown by ~8 GW between 2020 and 20241, with a large fraction of this growth occurring in Southern California. A high penetration of behind-the-meter (BTM) solar resources (e.g., rooftop solar) compounds utility-scale effects. California’s abundant utility-scale and BTM solar means a lot of clean electricity for CAISO’s grid, but during times of high solar generation and low overall and net grid demand, it can result in oversupply — causing solar curtailment and/or contributing to negative power prices. Figure 2 below shows the demand net of all wind and solar generation within CAISO between 2020 and 2024. In 2024, the average net demand during the midday hours (9 am-3 pm) has decreased by 45% since 2020. Given that the lowest cost generators get dispatched for energy production in the market first, this low demand results in the dispatch of lower cost resources to meet load.
Solar Generation and the Price of Energy
So, what’s the link between solar generation and the price of energy? The wholesale energy price is dependent on the marginal cost of generators (i.e., the cost of producing an additional kWh/MWh of energy. Resources are dispatched based on the merit order principles, i.e., the power plants with lower marginal costs are dispatched before resources with higher marginal costs. The higher the availability of low or zero marginal cost resources, the lower the wholesale energy price will be. Solar resources have a low or zero marginal cost, which makes solar a very inexpensive generator.
The low cost of solar puts downward pressure on wholesale energy prices, particularly in hours of solar energy oversupply. Negative prices, however, are a result of certain generators submitting negative bids. A negative energy bid for a resource implies that rather than being paid to supply energy, the supplier is willing to pay the grid operator for this supply. This occurs because a generator can have multiple revenue streams beyond the wholesale price of energy paid by the grid operator. The generator may receive tax credits on a $/MWh basis or possibly get paid for the production of Renewable Energy Credits (RECs), both of which incentivize generators to produce energy even when the wholesale energy price is very low or negative. The generator may also have longer-term fixed-price contracts that compensate generators irrespective of negative wholesale energy prices or have resource adequacy payments that compensate the generator for being online and supplying available capacity to the grid. In all these cases, the generator has alternate revenue streams that rely on the MWh produced from the resource, meaning that the unit can generate energy and remain profitable despite the negative energy prices.
Transmission also has a key role to play in the price formation, as negative prices are exacerbated by significant congestion during the solar producing hours. Excess generation would typically be exported to other regions to meet demand. However, as solar generation during the mid-day hours increases in Southern California (i.e., SP15), the solar exports are restricted and are unavailable to alleviate demand in other regions due to the lack of transmission availability during the peak hours. This effectively traps the solar generation in Southern California and exacerbates the conditions of oversupply in the region, further driving down prices.
Negative prices can be a high risk for developers since they result in lost revenue driven by high renewable curtailments. In general, a decrease in the net demand would result in generation ramping down to meet the demand needs of the hour, as generation and demand must be balanced at all times on the grid. However, certain thermal resources, particularly nuclear, gas, and coal units, must continue to generate due to their inflexibility and high costs of ramp/shutdown. This situation of oversupply on the grid requires more flexible, low-cost resources such as solar and wind to be curtailed to maintain the demand and supply balance. When generation from a particular unit has been curtailed, it’s unable to earn any revenue that’s supplied on a $/MWh basis.
Negative prices can also place significant risk on energy offtakers/corporate buyers who are locking in prices through long-term PPAs. For example, with a fixed-price PPA, if the price is consistently higher than the wholesale energy price, then the buyer is at risk of losing money. This is because when prices fall to low or negative wholesale energy prices, the offtake agreement may still require the buyer to purchase energy at the higher contracted rates. Similarly, with a contract-for-differences (CFD) virtual PPA (VPPA), if the wholesale price too often falls below the CFD “strike price,” the VPPA could find itself underwater for the clean energy buyer. In these situations, it is essential to understand the negative price exposure and include protections such as “price floors” to hedge against negative prices and ensure that the buyer does not need to pay a high price for power during low-priced hours.
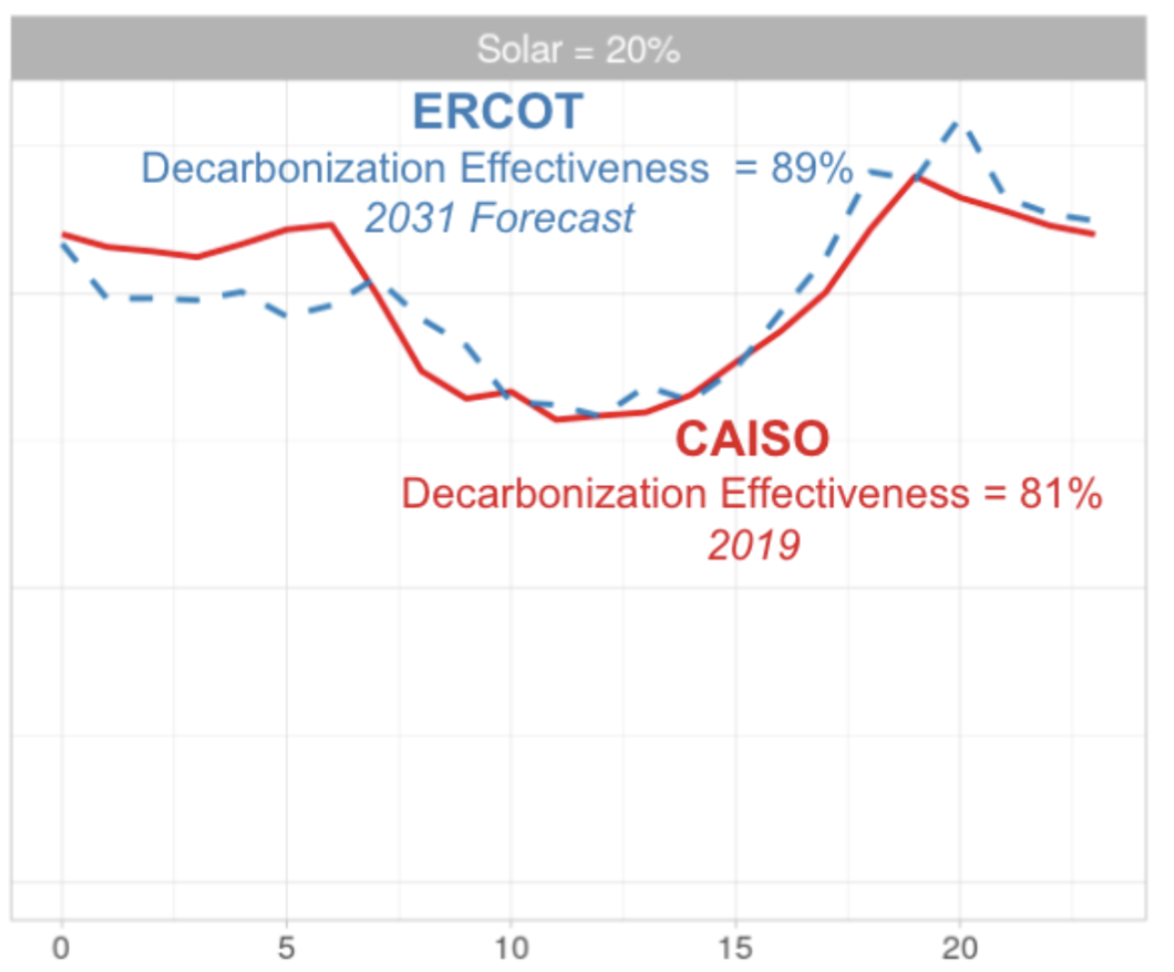
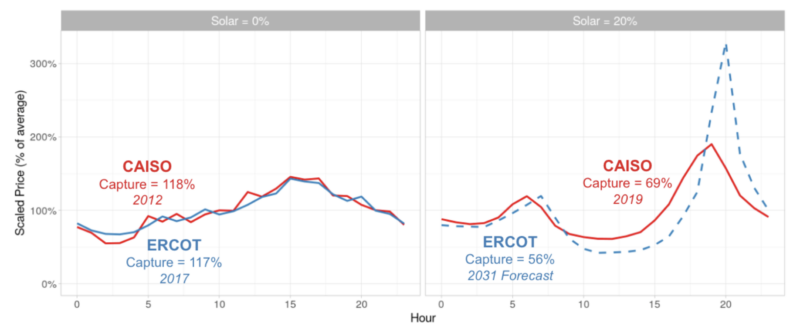
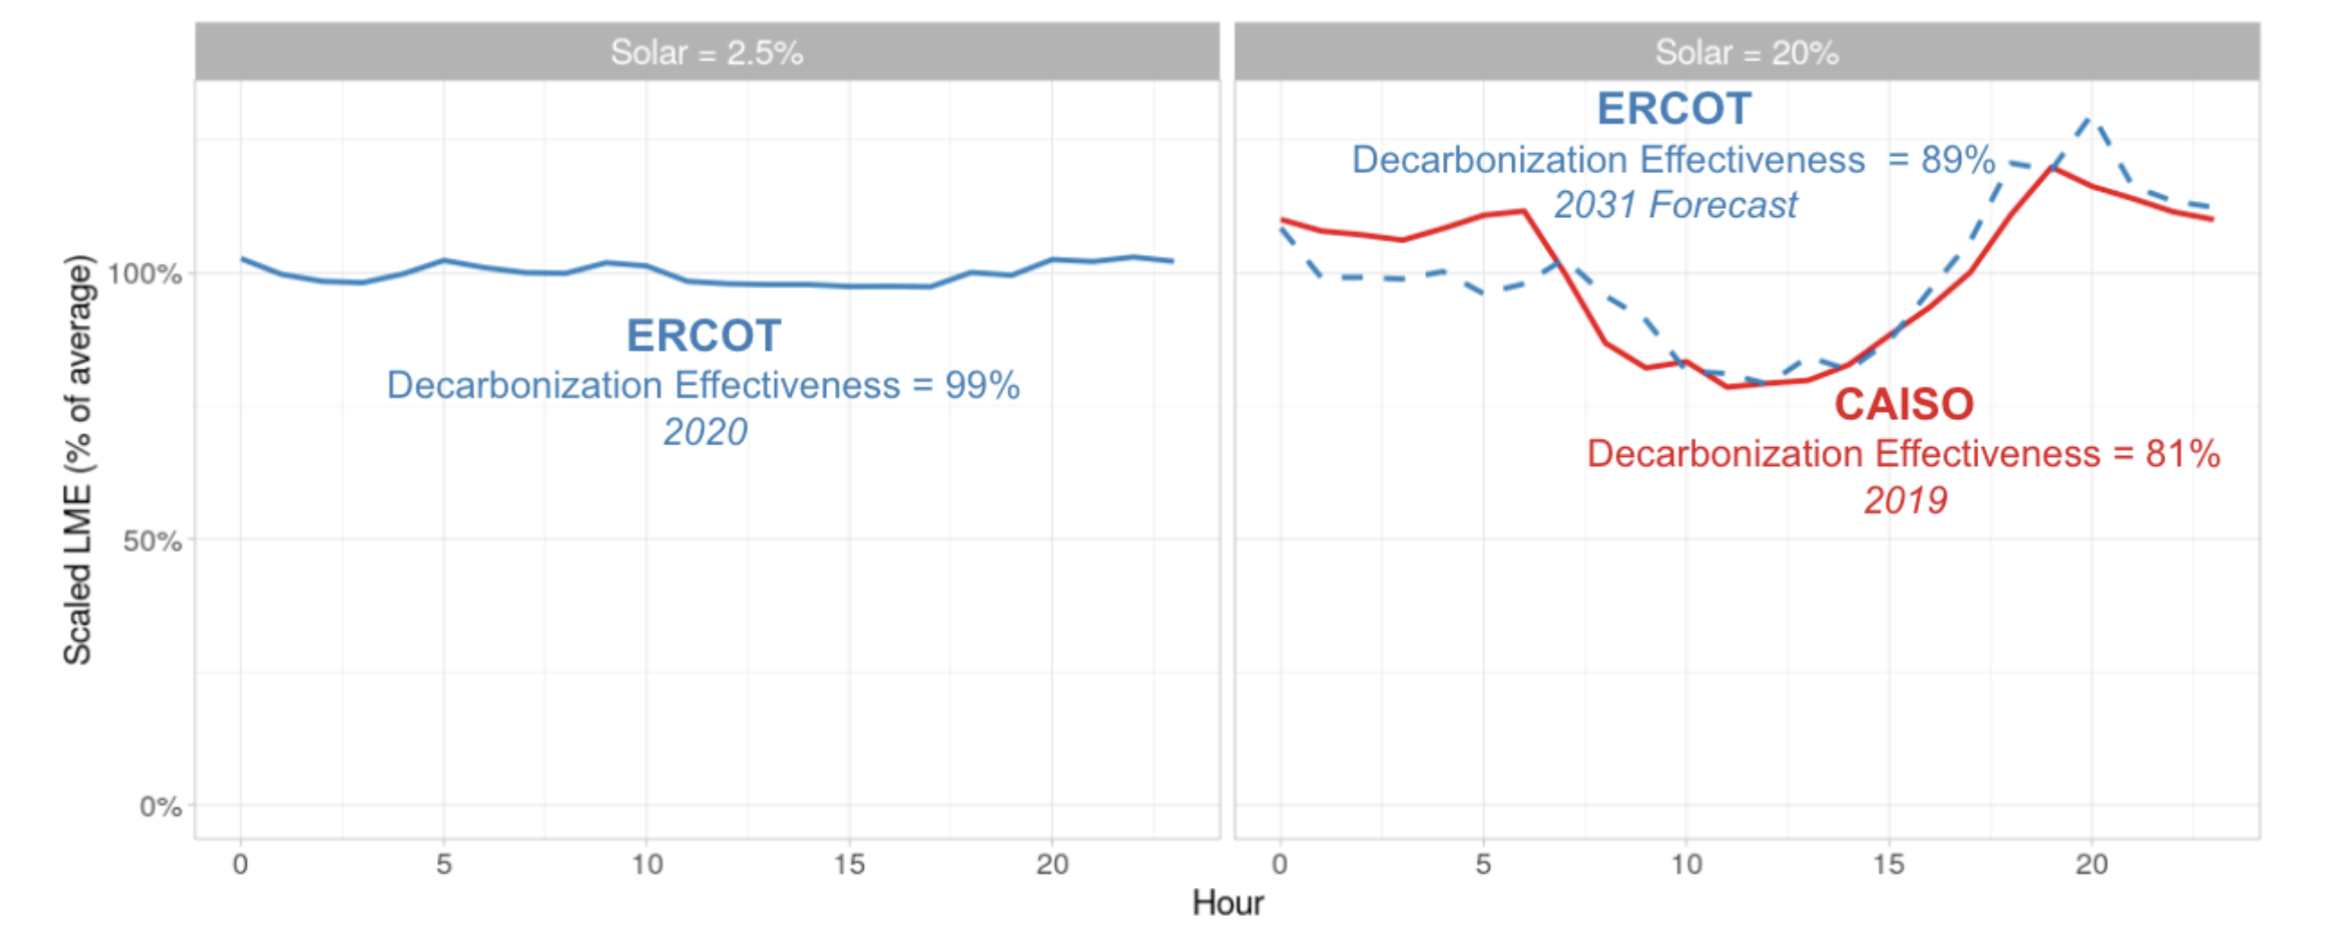
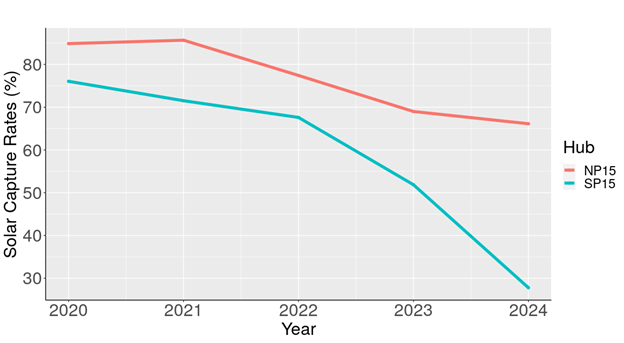
Solar capture rates (i.e., the annual generation-weighted price of solar generation divided by the around-the-clock [ATC] annual price) are an indicator of the revenue associated with solar in recent years. Lower capture rates imply lower revenues in the energy market. In SP15, negative prices have caused annual solar capture rates to plummet to less than 30% in 2024 and are expected to continue to fall going forward. This indicates that a utility-scale solar resource will make 70% less revenue than a resource that has constant generation across all hours of the year. Figure 3 below shows the comparison of solar capture rates in NP15 and SP15.
Solar and Storage Growth Going Forward
Despite these low capture rates, solar growth can be expected to continue in CAISO if alternate revenue streams continue to offset the low energy revenues, which will continue to contribute to negative prices. However, negative wholesale energy prices will also incentivize more storage builds since batteries can charge during the midday, low-priced hours. As evidence, battery capacity in CAISO has increased from ~ 4 GW in December 2022 to over 11 GW in June 20242. This capacity includes standalone, co-located, and hybrid resources. In this way, storage can offset the negative energy prices by charging when the solar would otherwise have been curtailed. This will reduce the magnitude and occurrence of negative prices and thereby increase solar capture rates in SP15. More importantly, storage will likely have a large impact on emissions by discharging during morning and evening peaks in demand, offsetting the generation of less clean and less efficient peaker plants. Negative energy prices and high solar curtailment rates will also provide a price signal indicating the value that building more transmission can have in relieving congested areas. Relieving congestion will eventually lead to lower curtailments and increased solar capture rates in SP15.
In the last few years, we have seen significant growth of solar buildout in other markets such as ERCOT and MISO. Based on MISO Futures, the additional solar expected to come online by 2042 ranges from 57 GW – 107GW3. Based on the ERCOT long-term system assessment (LTSA), the additional solar expected to come online by 2039 is ~ 29GW4. The current growth trends suggest we may start observing similar phenomena in these markets, with high amounts of solar generation driving down midday wholesale electricity prices, also known as the “duck curve”. This will have significant implications for the value of solar energy in these markets; while solar energy has historically been very valuable in ERCOT and MISO due to its ability to supply generation during periods of high demand and high prices, large amounts of solar additions will drive down net demand and prices. However, the extent to which solar growth leads to low and negative energy prices in other markets will depend on a number of other factors that drive price formation including the net demand growth, value of RECs, availability of production tax credits (PTCs), adoption of solar, and diversity of other resources, particularly wind and storage on the grid.
With these evolving dynamics, the risks for buyers and sellers must be carefully quantified and managed between different entities and require a careful assessment of future evolving fundamentals and uncertainty. As solar generation continues to gain momentum, solutions like storage and expanded transmission capacity will be key to managing these issues and ensuring a sustainable energy future.
This article contains a collection of information related to REsurety, Inc. and the commodity interest derivatives services and other services that REsurety, Inc. provides. Any statements of fact in this article are derived from sources believed to be reliable, but are not guaranteed as to accuracy, nor do they purport to be complete. No responsibility is assumed with respect to any such statement, nor with respect to any expression of opinion which may be contained herein. The risk of loss in trading commodity interest derivatives contracts can be substantial. Each investor must carefully consider whether this type of investment is appropriate for them or their company. Please be aware that past performance is not necessarily indicative of future results.
1 Jan 2020 Key Statistics: https://www.caiso.com/documents/monthlystats-jan2020.pdf
December 2024 Key Statistics: https://www.caiso.com/documents/key-statistics-dec-2024.pdf
2 2023 Annual Report on Market Issues and Performance, Pg. 36
https://www.caiso.com/documents/2023-annual-report-on-market-issues-and-performance-jul-29-2024.pdf
3 MISO Future Report, Series 1A, https://cdn.misoenergy.org/Series1A_Futures_Report630735.pdf
4 2024 Long-Term System Assessment for ERCOT region, https://www.ercot.com/gridinfo/planning
Contact Us to Learn More
"*" indicates required fields
Return to the blog post main menu.