
Insights Gained from the 2023 ERCOT Heat Event
Authored by Dr. Jessica Tomaszewski, Senior Research Scientist, REsurety

Senior Research Scientist
Summer is well underway across the United States, ushering in another year of heat and drought. The National Weather Service has issued over 4,800 excessive heat warnings nationwide this summer, invoking memories of the anomalous heat many parts of the country experienced just a year ago. The state of Texas notably experienced its second-warmest summer on record in 2023, with an average temperature over 85°F, four degrees warmer than the 20th century average. Energy demand and power prices soared alongside the temperatures – all variables that can be difficult to predict and prepare for without the right tools and data.
We at REsurety are reaffirming our commitment to data-driven practices and are reflecting on the insights gained from the summer of 2023 in order to best understand and predict heat waves’ impacts on the electrical grid in 2024 and beyond.
What caused the heat wave?
The historic heat in 2023 was brought to Texas via the effects of a heat dome, a meteorological phenomenon characterized by the presence of extreme heat over a region that lingers for an extended period of time.
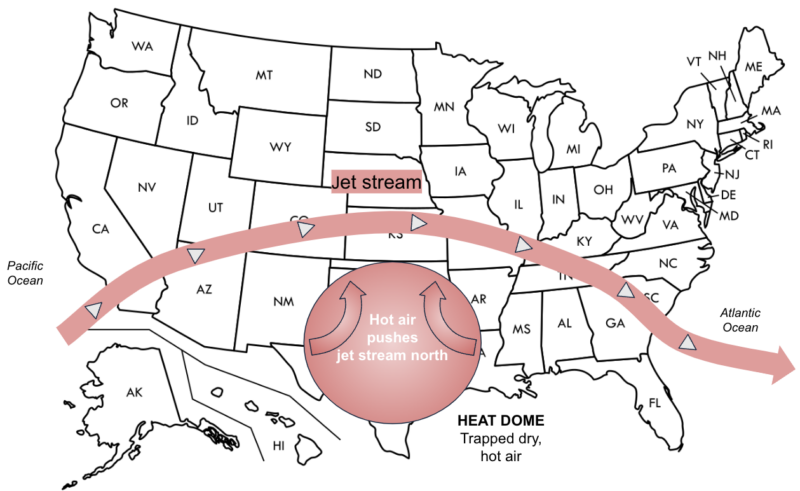
To best understand heat domes, it helps to have a bit of knowledge about atmospheric dynamics. Generally, the atmosphere is a three-dimensional fluid, and the upper layer affects the surface conditions (and vice versa). An important feature of the upper level is the jet stream, a fast current of air four to eight miles above the ground that directly affects (and is affected by) surface weather patterns while acting as a sharp boundary between warm and cold air masses. When the jet stream takes on a more wavy shape, troughs and ridges form, which drive weather at the surface below. Ridges form when the jet stream arcs northward, and they are associated with warm air, high pressure aloft, and dry, sunny weather at the surface.
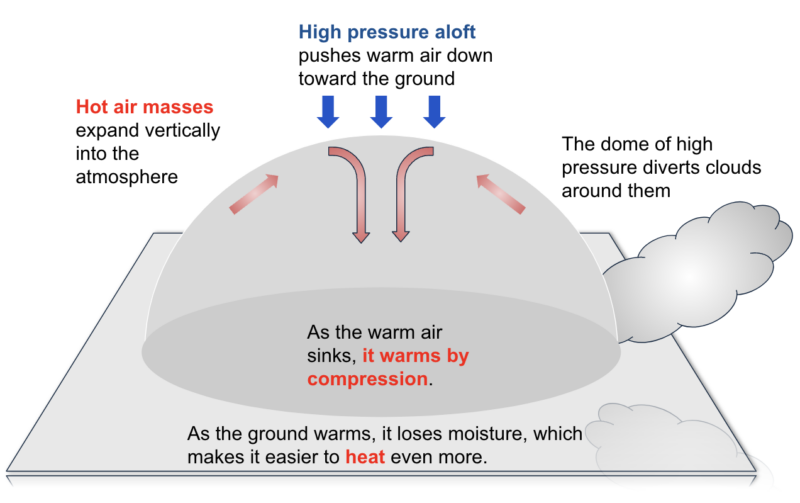
During a heat dome event, a stronger-than-usual ridge in the jet stream like the one present in the summer of 2023 causes a hot air mass to form (illustrated below). A key feature of a heat dome is that it is self-sustaining, meaning it is fueled by its own impacts. As the hot air in a heat dome rises and expands, it creates a tall column of high pressure that pushes warm air down toward the ground (right), which suppresses clouds and precipitation. Air sinking against the ground leads to compressional warming, as dictated by the laws of thermodynamics. The combination of ample sunshine and compressional warming warms the surface even more. Warm surface conditions quickly dry out the soil moisture, another contributor to efficient heating. The now-hotter air mass continues to expand vertically in the atmosphere and deepens the ridge in the jet stream, and the cycle persists, sometimes for weeks at a time.
Source: REsurety
How do heat waves impact demand and renewable energy production?
Such extreme heat can have severe or even deadly human impacts, so air conditioning is widely used to keep people safe and comfortable. As more homes utilize air conditioning, powering those units requires significant energy from the electrical grid, which in the state of Texas is largely operated by the Electric Reliability Council of Texas (ERCOT), to meet that demand.
The relationship between hot temperatures and energy demand can be seen in the below hourly time series at a point in central Texas over the month of August 2023. Temperature is shaded in orange, with a horizontal line at 100 ºF to draw attention to the large quantity of consecutive 100+ ºF days that occurred. The blue line represents the total ERCOT grid demand, with the pre-2023 demand record of 80 GW dashed horizontally to emphasize how many times that value was surpassed in 2023. A new ERCOT demand record of 85 GW was set on August 10.
The heat and high demand led to high power prices as well, which is seen in the green plot of real-time prices at a nearby hub. Prices surpassed $1,000/MWh over a dozen times, and hit the $5,000 price maximum on August 17. Interestingly, the highest price day does not coincide with the day with the highest temperatures and demand, which occurred on August 10.
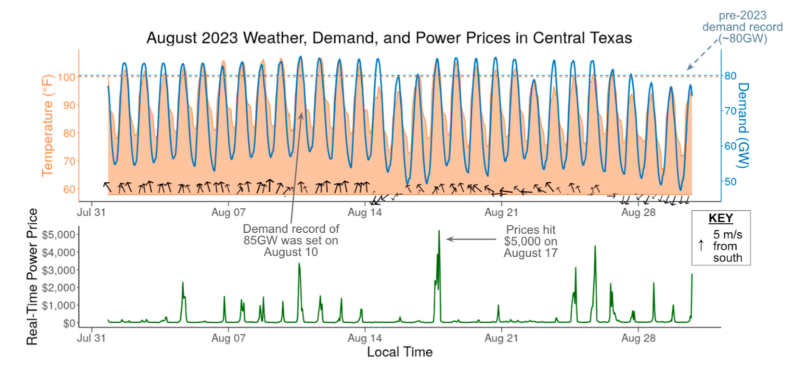
The reason for the difference in power prices between two similarly hot days largely lies in the availability (or lack thereof) of low-cost sources of electricity generation like wind and solar. The arrows in the above time series represent the relative magnitude and direction of the wind speeds experienced in ERCOT. On August 17, weak winds caused wind generation to dip below the ERCOT “low wind” scenario, which, when coupled with temperatures above 100 ºF, forced ERCOT to utilize more expensive generation sources to meet high demand, leading to the extreme prices seen on that day.
Generally speaking, heat domes can have variable impacts on renewable generation depending on the energy source and event-specific weather conditions occurring at the surface. According to Vaisala’s Climate Reference Tool, the 2023 heat dome led to clear, dry conditions that were up to 20% sunnier than usual over much of Texas, allowing above-average production of solar energy across the month. Conversely, the heat dome did not have a clear impact on average wind speeds: Wind speeds in some areas of Texas were above average in August 2023 when compared to a typical August, while others were below average. Data does not show a correlation between temperature and wind generation in ERCOT. Some of the hottest days did have low wind generation (like August 17) but others didn’t. Wind generation isn’t always low on hot days, though from a grid reliability and price management perspective, it’s important to plan for the scenario where it might be.
How should extreme events be accounted for in power price forecasts?
Atypical weather conditions like heat waves can both increase demand and limit the generation that’s available to meet that demand, thereby affecting power prices. The status quo approach in power price forecasting is to assume weather conditions in the future will resemble a single, “normal” weather year. The result of the weather-normal year approach is that price forecasts lack awareness of the extreme price events produced by extreme weather events.
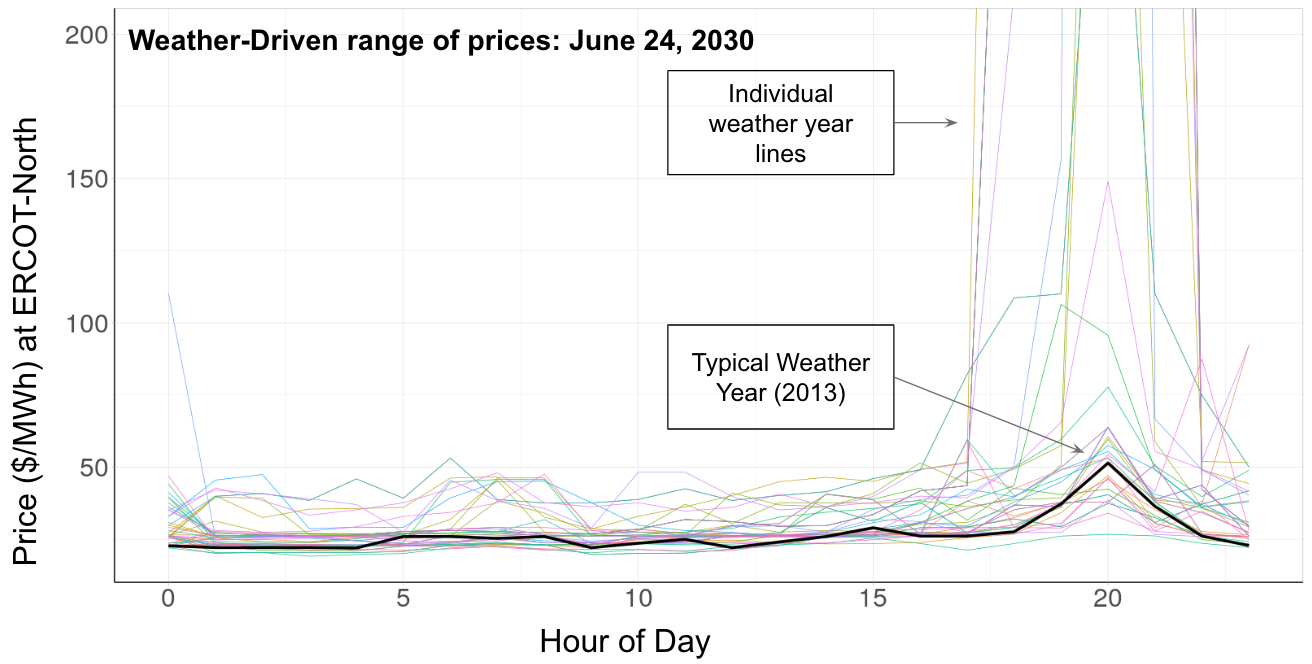
However, REsurety takes a different, Weather-Smart approach: Instead of using a typical weather year to create a power price forecast, we incorporate extreme events into our forecasts by simulating demand and generation under a variety of weather conditions. The value of this approach is illustrated in the plot below, wherein the hourly forecast power prices are plotted for a June day in 2030. The black line denotes the price of power that we forecast if we assume weather conditions resemble a typical weather year of 2013, and all of the individual colored lines indicate the power prices that we forecast based on different weather conditions. It is clear that the resulting forecasted power prices for a given day are largely impacted by the weather conditions used as input for the model and that some weather conditions can lead to extreme power prices.*
Outlook
Heat domes are not a Texas-specific phenomena. In June 2021, an anomalous ridge in the jet stream formed in a particularly unusual location over the Pacific Northwest, causing record high temperatures, severe drought, and wildfires. This past June, a heat dome with triple-digit heat indices stagnated over the Northeast and Mid-Atlantic regions for over a week, prompting the grid operators at PJM to issue a Hot Weather Alert to mitigate expected increases in electricity demand. Much of the continental United States needs to be prepared for the potential of extreme heat.
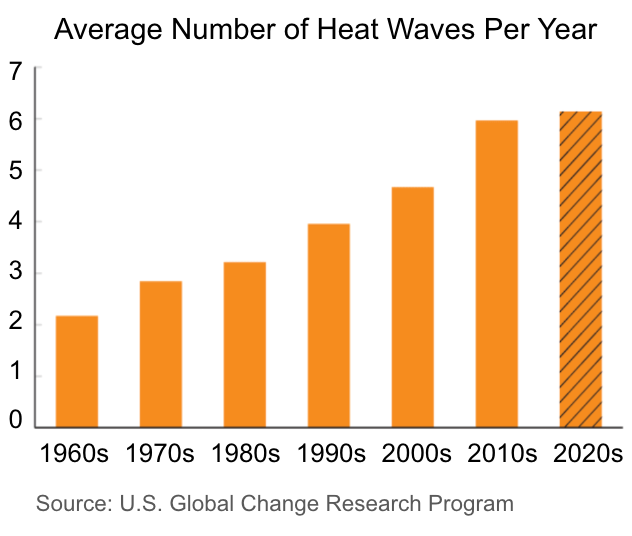
Furthermore, the average quantity, intensity, and length of heat waves have steadily increased in the United States over the last several decades. According to the Intergovernmental Panel on Climate Change, extreme heat waves are predicted to be almost twice as likely as they are today and nine times more likely than they were in the pre-industrial period [1]. As extreme heat waves become more common, understanding the intersection between weather, power markets, and energy economics will only become more critical, and REsurety will continue to lead efforts to advance this understanding.
REsurety is a mission-driven organization dedicated to accelerating the world’s transition to a zero-carbon future. We provide software and services to support both the financial and sustainability goals of clean energy buyers, sellers, and investors. Our software offers data-driven insights at various stages of the project lifecycle from initial exploration to portfolio management. Our services leverage our domain expertise and deliver solutions tailored to the unique needs of our customers. Reach out to learn more: [email protected].
*While REsurety’s Weather-Smart approach offers advanced forecasting capabilities, users should be aware that all projections are subject to uncertainties and potential inaccuracies.
References
[1] IPCC Summary for Policymakers from Climate Change 2021: The Physical Science Basis. Contribution of Working Group I to the Sixth Assessment Report of the Intergovernmental Panel on Climate Change.
Return to the blog post main menu.

