November 22, 2024
A view of Q3 2024 U.S. renewable energy performance
REsurety creates the State of the Renewables Market report every quarter to provide readers with data-driven insight into the value and emerging trends of renewable generation in U.S. power markets. Please fill out the form to access the full report, the Editor’s Note is below.
Editor’s Note:

Analyst
Senior Analyst,
Analytics Services

Lead Analyst
Associate,
Analytics Services

Editor
SVP,
Customer Experience
AI Introduces Unprecedented Power Needs: How Will Clean Energy Markets Be Impacted?
The landscape of U.S. power markets is being dramatically reshaped by an unprecedented wave of data center development, driven largely by artificial intelligence (AI) and cloud computing demand. The headlines are alarming: hyperscalers are announcing tens of billions of dollars of investments this year in data center infrastructure, ISOs are forecasting supply shortfalls and/or reliability concerns, and load forecasts are off the charts relative to historical growth rates.1-3
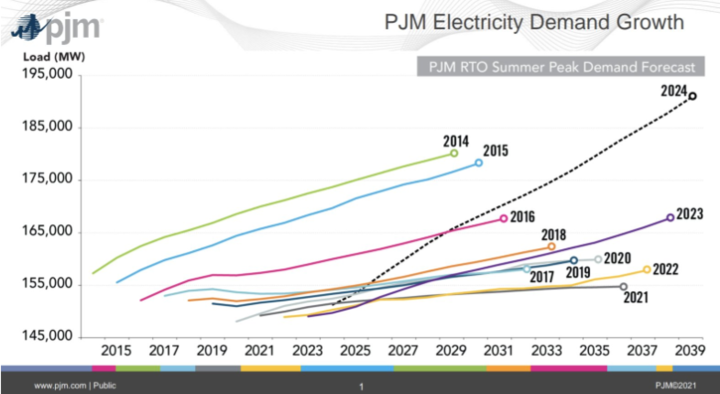
With a historically reliable power supply and low-latency fiber network, the PJM region is currently a priority for digital infrastructure development – with more than 4GW already in Northern Virginia alone. PJM’s latest load forecast report forecasts a 1.6% annual growth rate for summer peak demand and 1.8% for winter peak demand, represented in Figure 1. Both growth rates are multiples larger than what we have seen historically, doubling from the estimates released last year with data center growth cited as a major contributor.
To put these numbers into perspective, summer peak demand in PJM is expected to increase above this year’s peak by almost 42GW in 2039 – representing a 28% increase. The winter peaks are forecasted to be 31% higher than last winter’s. This dramatic expansion puts grid reliability at risk, and also limits coal retirements in the next few years.2
What does this all mean for clean energy buyers or investors trying to plan for the future? Our guidance has generally fallen into one of three categories:
First, start with the historical facts on the ground.
All too often, we see forecasts – whether about future power prices, intra-day price volatility, wind/solar capture rates, congestion and curtailment, or emissions impacts – that are disconnected from historical realities. We find that this sort of discontinuity is very rarely warranted in power markets, even in a time of accelerated change (such as today).
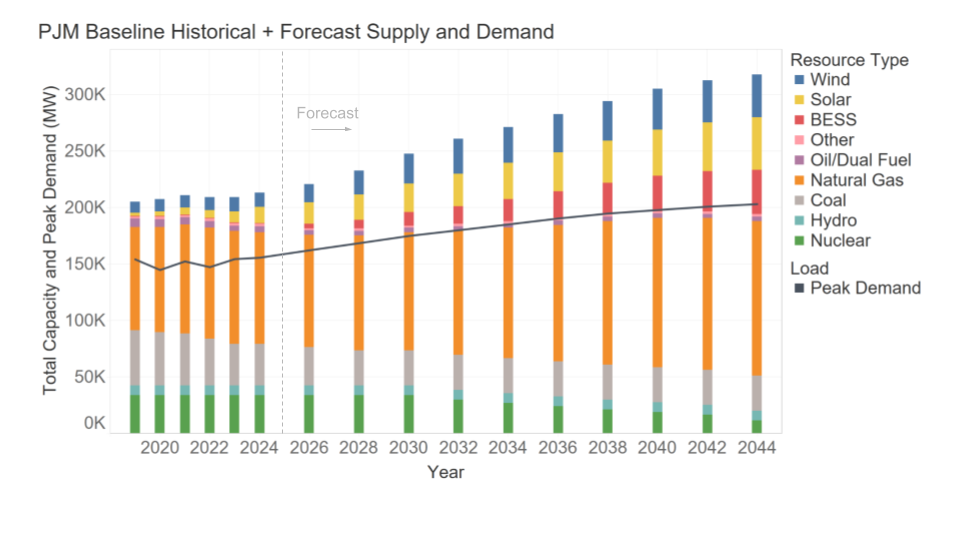
Figure 2 shows the historical and REsurety’s forecasted generation supply (colored bars) and peak load (line) in PJM. While the market will be tight over the next few years, after that we expect load growth to be more balanced with supply growth.
The result of this will be elevated prices in peak winter and summer months over the next few years, followed by smoother seasonal profiles in later years. Overall, our forecasted PJM power pries are increasing over the next 20 years in all of our modeled scenarios.
Second, get back to fundamentals.
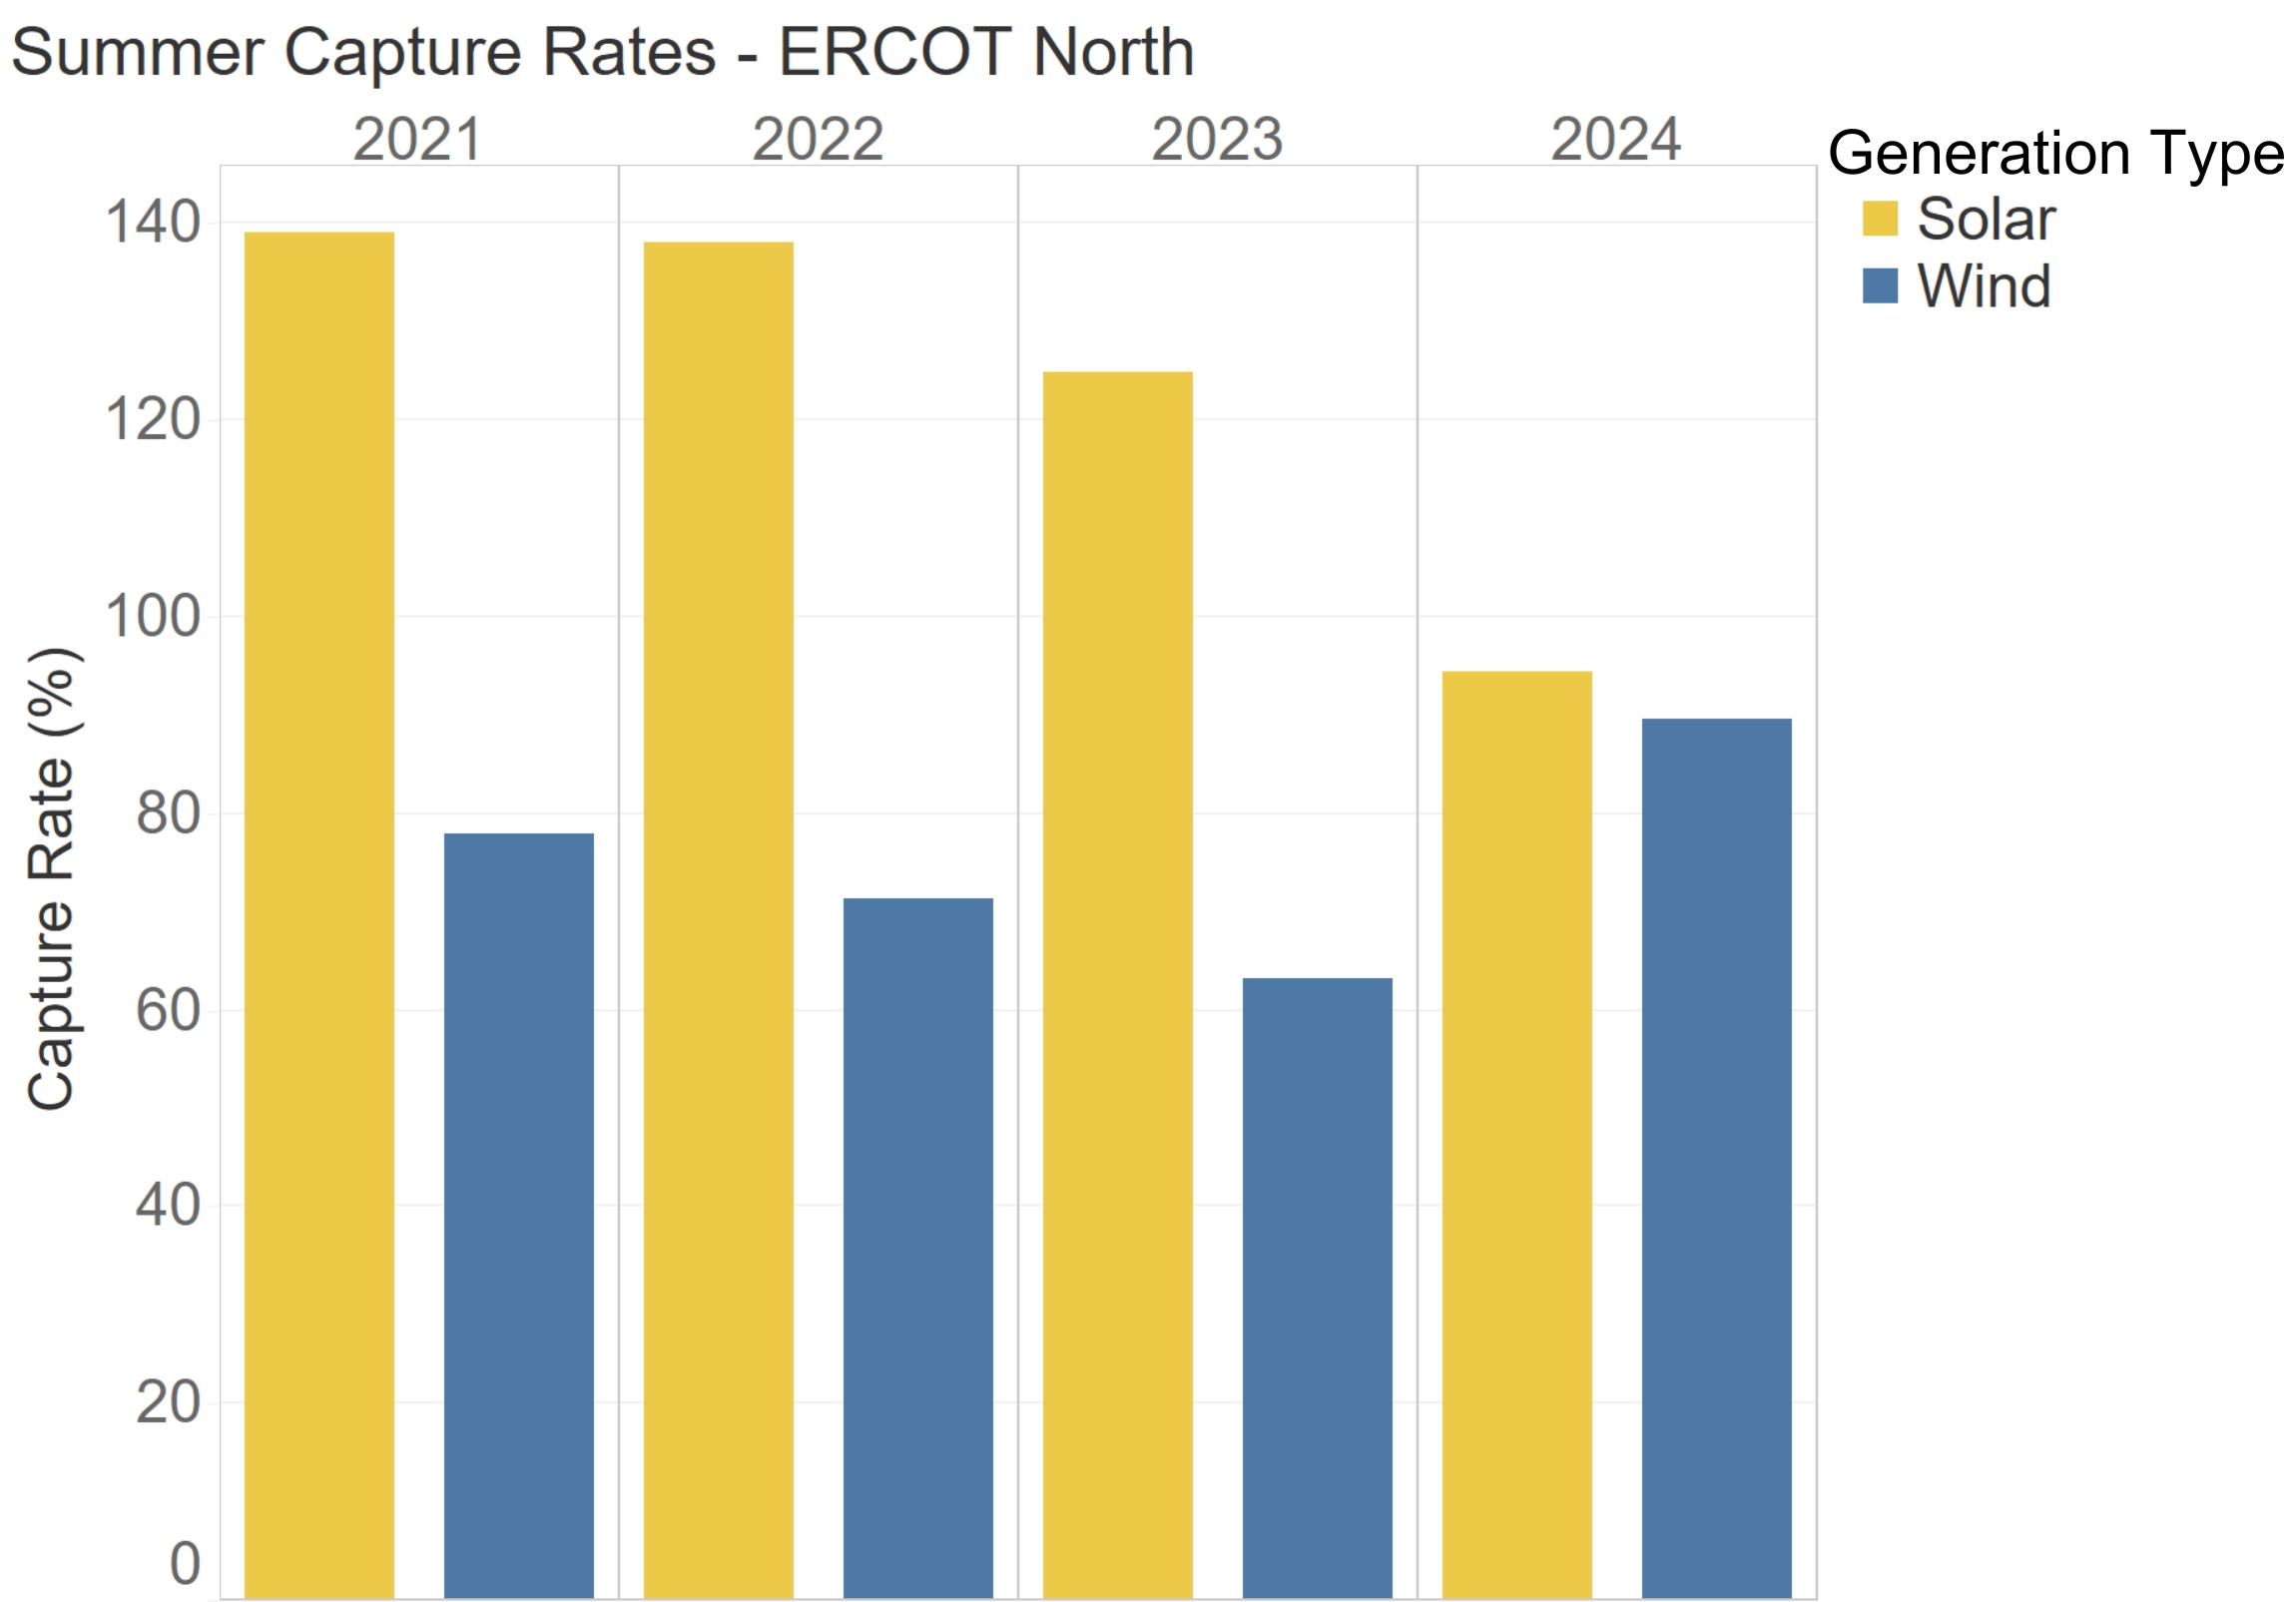
While AI-driven load growth is a new variable to consider when evaluating the future, it is not the only variable in power markets. Fuel prices, renewable energy penetration, hourly weather conditions, and congestion continue to dominate the value story for renewables, and likely will for some time. Consider solar capture rates in ERCOT this summer: while ERCOT set a new peak load (thanks in part to the 7+ GW of data centers in Texas), the summer capture rate for solar projects in Q3 hit a record low, dropping below 100% for the first time ever due to the rapid continued buildout of solar in Texas (Figure 3). Wind capture rates, meanwhile, have actually increased, as solar balances out the renewable mix. Our forecasts see this trend continuing into the future, with the average solar capture rate over the next decade at ~60%, as solar penetration continues to increase in ERCOT.
Third, do not underestimate the impact of transmission.
This is relevant to multiple areas in the era of AI load growth. Data centers are increasingly struggling to get load interconnection agreements in place, causing delays and/or relocations of planned investments. This is already acting as a brake, all else equal, slowing AI-driven load growth. Additionally, congestion is on the rise, resulting in renewables getting bottlenecked and becoming undeliverable to load.
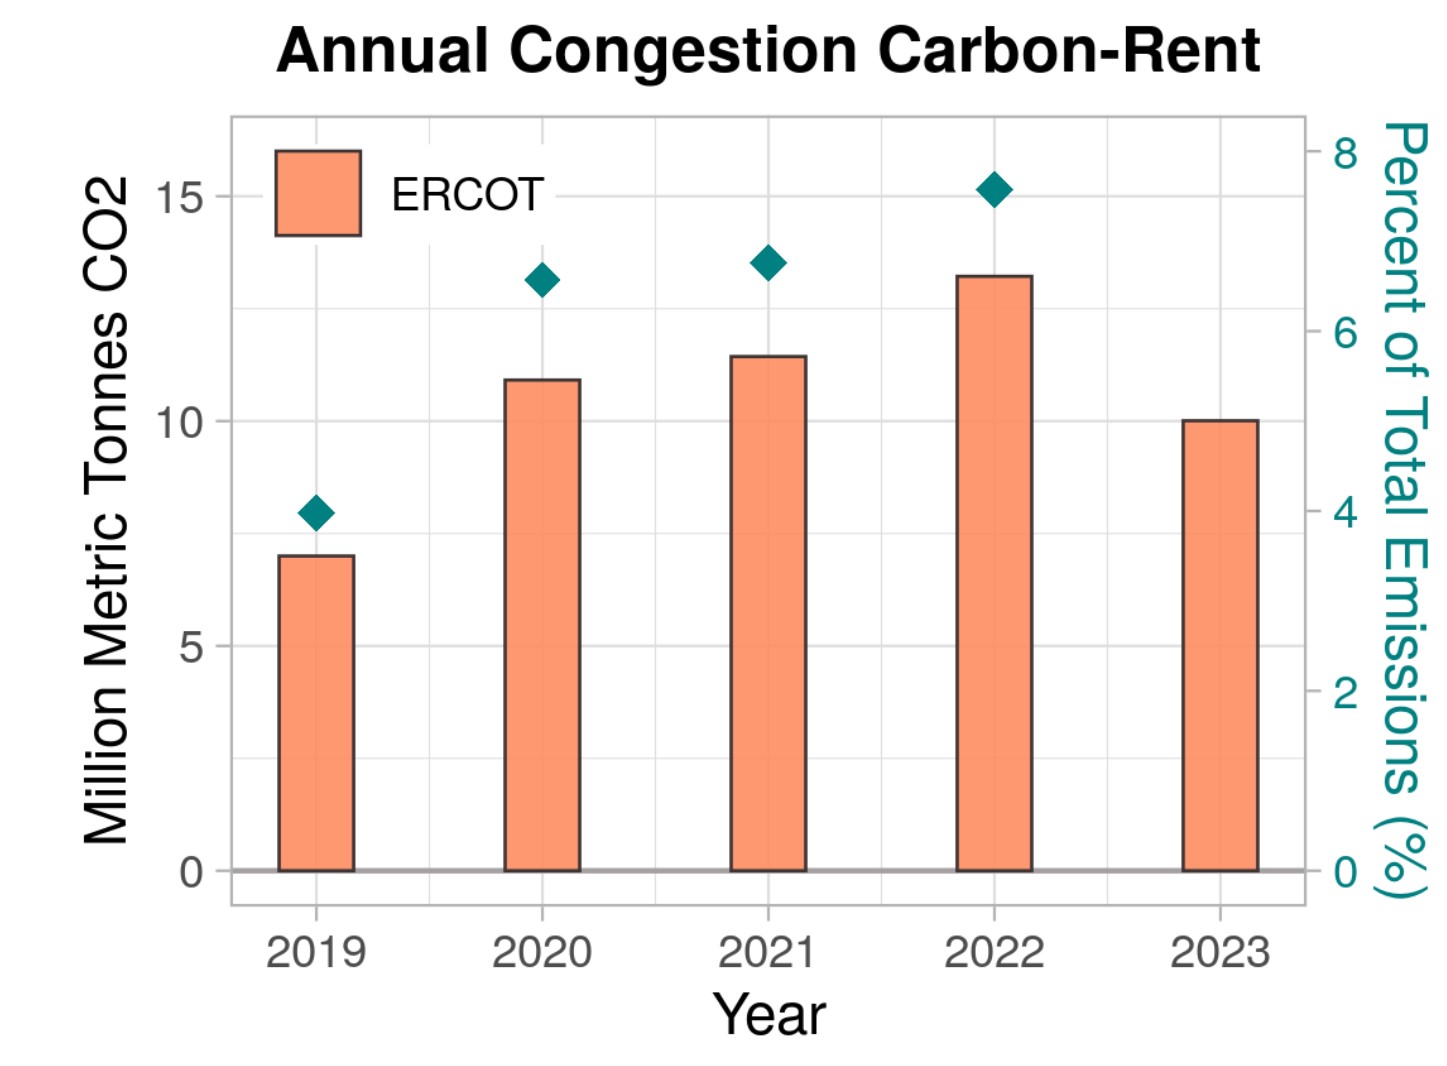
This has both financial and environmental implications: project owners and corporate offtakers with basis-sharing provisions will be financially impacted, and the emissions benefit of the clean generation will be significantly reduced. Our recent study found that 10 million metric tonnes of CO2e were emitted in ERCOT alone last year as a consequence of transmission congestion (Figure 4).4 When developing a clean energy purchasing strategy, accurately evaluating the “deliverability” of the generated clean energy is an increasingly critical consideration.
The intersection of AI-driven load growth and clean energy development presents unprecedented opportunities, but success demands strategies grounded in historical data, fundamental market drivers, and realistic infrastructure constraints – and not over-reacting to headline growth numbers. At REsurety, we remain committed to providing the analytical tools and expertise needed to navigate these complexities and make informed decisions in this rapidly evolving market landscape.
Sources:
1. Bain & Company. Technology Report 2024. https://www.bain.com/globalassets/noindex/2024/bain_report_technology_report_2024.pdf, 2024.
2. PJM Resource Adequacy Planning Department. PJM Load Forecast Report. https://www.pjm.com/-/media/library/reports-notices/load-forecast/2024-load-report.ashx, 2024.
3. Gelles, D. A.I.’s Insatiable Appetite for Energy. https://www.nytimes.com/2024/07/11/climate/artificial-intelligence-energy-usage.html, 2024.
4. Sofia, S.; Dvorkin, Y. Carbon Impact of Intra-Regional Transmission Congestion. https://resurety.com/carbonimpact/, 2024.
Q3 2024 Report Download
"*" indicates required fields
Return to the blog post main menu.


