August 23, 2024
A view of Q2 2024 U.S. renewable energy performance
REsurety creates the State of the Renewables Market report every quarter to provide readers with data-driven insight into the value and emerging trends of renewable generation in U.S. power markets. Please fill out the form to access the full report, the Editor’s Note is below.
Editor’s Note:

Analyst
Senior Analyst,
Analytics Services

Lead Analyst
Associate,
Analytics Services

Editor
SVP,
Analytics Services
Deliverability: Can Clean Energy Reach Consumers?
Clean energy generators are the fastest growing sources of new energy on grids across the country. But if the impact of those new projects is going to be maximized, and utilized meaningfully in hourly matching carbon offset techniques, the country also needs to invest large sums in improving transmission infrastructure to get the clean energy to load centers. There have been a couple of recent announcements aiming to speed up the development of much-needed transmission (e.g. FERC Order 1920 and Department of Energy TSED funding), but how much of a problem is transmission currently?
To answer this question, we’ll use the concept of “deliverability” – in other words, how much clean energy can reach consumers in a given location. The concept of deliverability is already built into the market prices that system operators publish. There are three components to Locational Marginal Prices (LMPs); energy, congestion, and line losses. Line losses tend to contribute relatively little to the overall prices, and so we can use the difference in LMPs between two locations to estimate the deliverability of the energy. When the LMP at a generator diverges materially from the LMP at the load center, this is a sign that the location is experiencing congestion – either high prices that encourage generation, or low (even negative) prices resulting in renewable generator curtailment.
For this analysis, we’ve defined power as “deliverable” if the LMP at the generator is within 10% of the LMP at the load center. Renewable generation output during periods with greater than 10% LMP divergence is likely subject to congestion, and is therefore considered undeliverable. This is a somewhat simple metric, but it aims to boil down a complex issue into something digestible and relevant; after all, deliverability is a key component in the developing hourly matching frameworks.
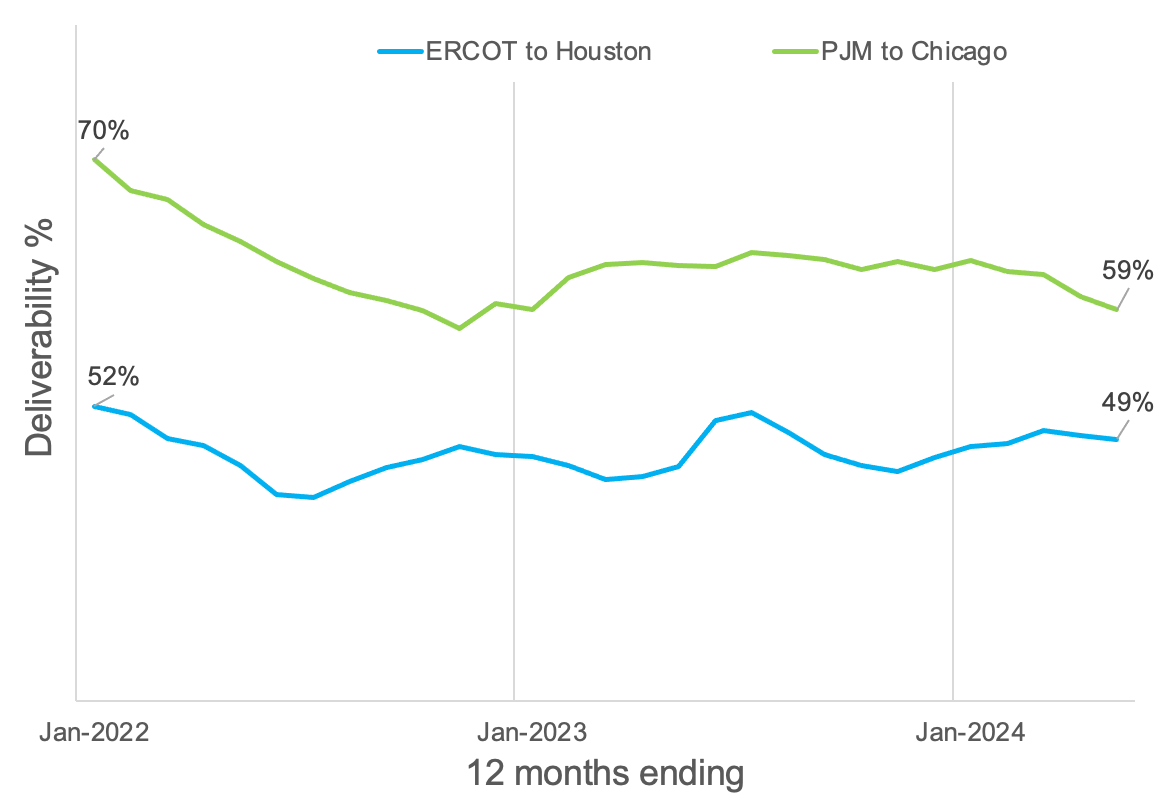
In Figure 1, the 12-month trailing average of deliverability is shown for clean energy generators in ERCOT and PJM and load centers in Houston and Chicago, respectively. Historically, only between half and two-thirds of clean power is “deliverable” to these major load centers. This highlights that transmission congestion has been, and still is, a meaningful issue. It’s also notable that despite higher penetration levels of wind and solar in ERCOT, the deliverability of clean energy to Chicago has dropped more rapidly since the start of 2021.
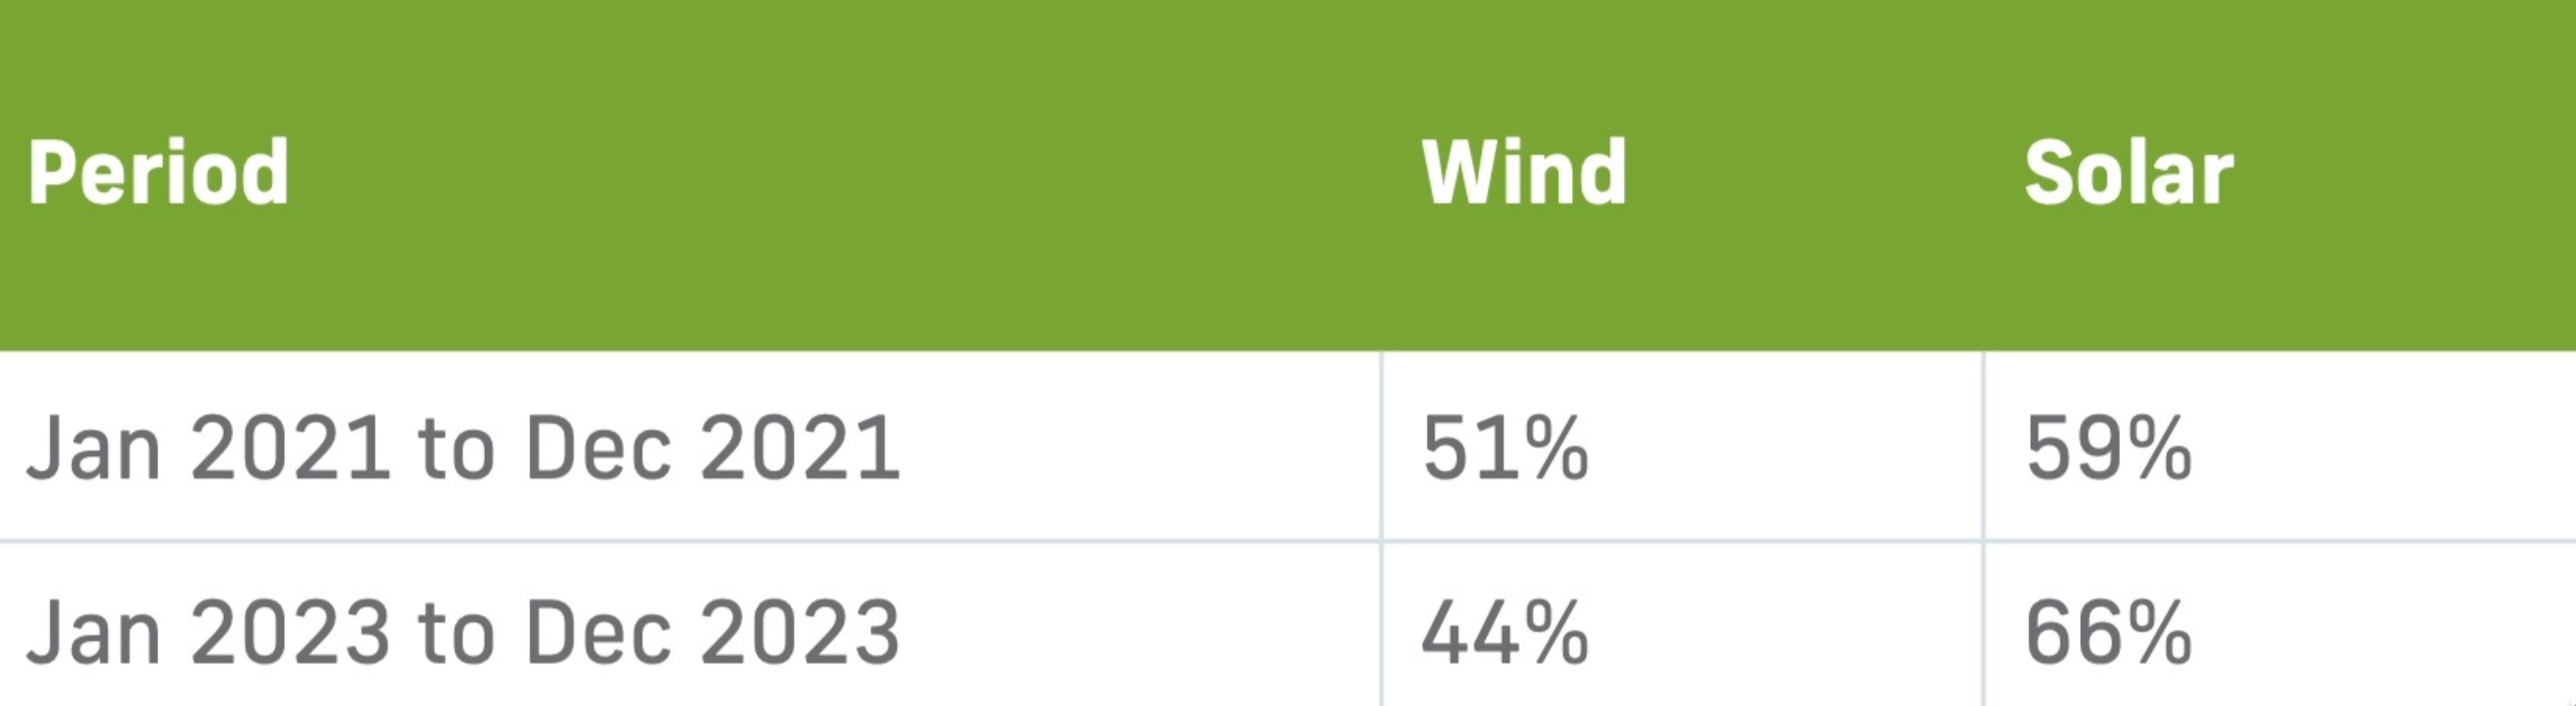
When we look a little deeper at the ERCOT deliverability, separating the results for wind and solar projects, the story of the flatter deliverability trend becomes clearer. The deliverability of wind in ERCOT has been trending downwards over the past few years, while solar has trended upwards. There are two factors in favor of solar’s better deliverability: timing and location. Solar’s on-peak generation coincides with higher load, leading to fewer congestion issues. Furthermore, the operational solar fleet is more geographically dispersed compared to the wind fleet, meaning fewer solar projects are subject to major transmission constraints (such as in the Texas Panhandle and Gulf Coast).
Of course, these trends will evolve over time as more clean energy is added to the grid, thermal generators are decommissioned, energy storage capacity expands, gross and net load profiles evolve, and transmission either stays constant or gets upgraded. This metric is just the beginning of our efforts to analyze this complex issue. A REsurety whitepaper on deliverability is in the works, covering more regions and diving deeper into the underlying causes and resulting carbon impacts.
Q2 2024 Report Download
"*" indicates required fields
Return to the blog post main menu.