August 11, 2023
A view of Q2 2023 U.S. renewable energy performance

REsurety creates the State of the Renewables Market report every quarter to provide readers with data-driven insight into the value and emerging trends of renewable generation in U.S. power markets. We use our domain expertise in power markets, atmospheric science, and renewable offtake to analyze thousands of locations and summarize key findings here. All of the data behind this analysis is curated by REsurety’s team of experts and available via our software products. It includes aggregated metrics for wind and solar projects operating in the U.S. All summaries are calculated using hourly-level data, and all energy-weighted price metrics are calculated using concurrent weather-driven generation and energy price time series. Please fill out the form at the bottom of the page to access the full report, the Editor’s Note is below.
Editor’s Note:

Lead Analyst
Senior Analyst, Analytics Services

Editor
Director, Analytics Services
June in Texas: High Heat, Not So High Power Prices
I recall the buzz during the summer of 2019 when power prices in ERCOT reached $9,000/MWh for a few hours and the speculation about how prices may have been lower with more solar on the grid. Fast forward to 2023. The hot topic to start the hot summer is instead how power prices may have been even higher without the observed solar generation. Solar energy’s contribution to grid resilience during this summer’s heat waves has even become mainstream news, with headlines about the absence of the power supply scares of previous summers.1
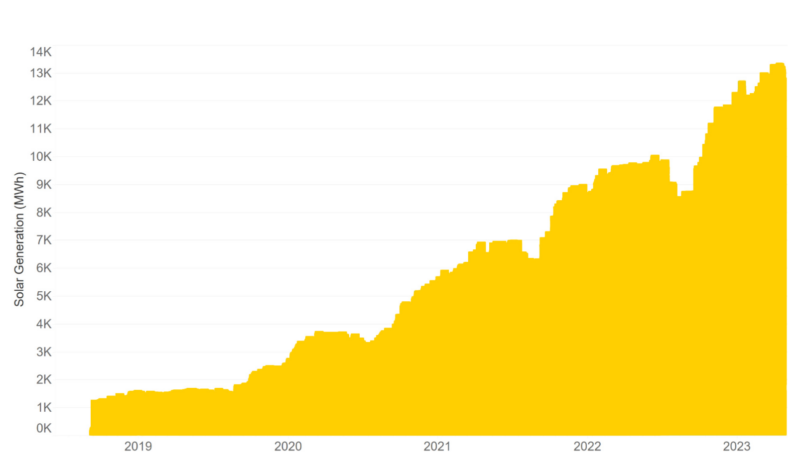
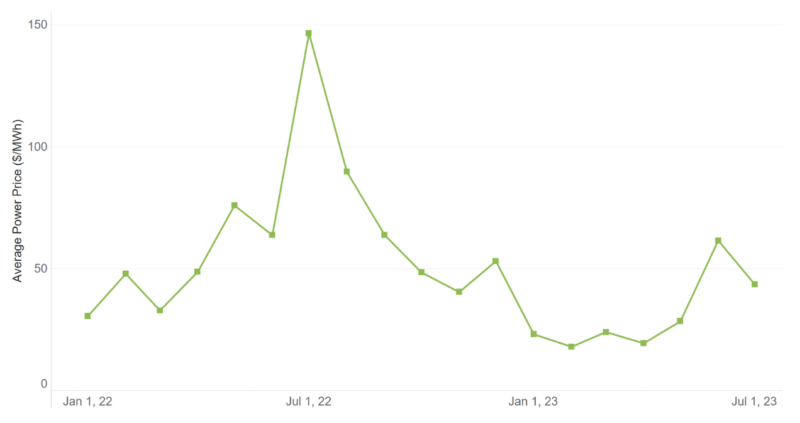
Indeed, solar capacity in ERCOT has grown over the last few years. Observed hourly solar generation regularly approached 13,000 MWh heading into this summer, compared to a maximum of approximately 10,000 MWh the same time last year (Figure 1). However, despite record breaking demand and a few hours of scarcity prices in June, the average monthly prices remained below the values from last summer (Figure 2). The average power price in June 2023 at ERCOT North Hub was $2 less than in June 2022 despite exceeding the monthly peak demand record by over 4,000 MW.2


REsurety estimates that the average power price in ERCOT this June would have been nearly double the observed value without the additional solar generation. We also estimate that solar resources would have captured 27 percent more of this higher average monthly price, while wind resources would have captured 14 percent less.
Continued growth in solar capacity is expected to further degrade the capture rates for solar in ERCOT, while supporting capture rates for wind and keeping average prices lower for consumers. REsurety’s Weather-Smart fundamentals power price model shows reductions in solar value as solar buildout ramps up and the highest price hours are pushed out to the early mornings and evenings. At the same time, the reduction in power prices during afternoon hours also helps to limit downside risk to wind generation value. The lowest wind capture rates tend to occur in months that experience periods of low wind resource coinciding with periods of high demand from high temperatures.
We continue to watch how solar energy resources will perform with more hot weather still to come. Regardless of how the rest of this summer turns out, the impact that increasing solar penetration is having on markets like ERCOT is already apparent, and increasingly suggests that the near future is fundamentally different from the recent past. We will keep sharing our data findings in these quarterly reports as well as trends and thought leadership on our corporate blog.
Footnotes:
- The U.S. Power Grid Withstands the Heat, So Far: Electric supplies from renewable energy, hydropower and batteries bolster vulnerable parts. The Wall Street Journal, July 23, 2023.
- Based on available peak demand records for June 2023 reported by ERCOT.
Q2 2023 Report Download
"*" indicates required fields
Return to the blog post main menu.

