March 8, 2021
While detailed analysis of the Texas event crisis is still ongoing, the authors note, they examine some of the notable takeaways and trends in renewable energy markets from last year’s performance.
The deep freeze in Texas seems almost certain to be the top energy story of 2021. The meltdown of the ERCOT power grid had dramatic implications at the individual project level, as the financial performance of each project was driven by the weather conditions at its particular location. For example: iced blades caused some wind projects to shut down near the beginning of the cold weather event, missing out — or causing their offtakers to miss out — on a potential windfall due to the record-breaking $9,000/MWh pricing that was sustained for days during the event. Meanwhile, some solar projects exceeded expectations during key high-priced hours.
We are excited to dig into the specifics of which projects performed and outperformed as the granular data becomes available. While detailed analysis of the Texas event crisis is still ongoing, we’ve analyzed the hourly generation and price data from every available renewable energy project in 2020 to help understand takeaways and trends in renewable energy markets from last year’s performance.
The shocking events of last month notwithstanding, we expect many of these trends to continue in 2021 and beyond, while other new trends are sure to emerge as well. Here, we share seven of our findings, and the data behind them.
1. Renewable energy project value continues to be highly variable.
The value of renewable energy project generation across the country in 2020 ranged from a low of less than $1/MWh to a high of $57/MWh. (Measured as the value of project generation, sold at the nodal/hub real-time Locational Marginal Price (LMP), where project generation is either observed or modeled depending on data availability.) A complete summary of renewable energy project values observed in 2020 across various markets is below:(N/A values represent limited data)
Generally, we see that the highest-value projects are located in areas of low renewable penetration of the same technology — for example, wind in CAISO or solar in ERCOT. These projects can distinguish themselves by offering a production profile that is complementary to other renewable energy projects nearby and can capture high-value hours currently underserved. Said otherwise, projects that can generate when generation from other sources is low stand to benefit from higher market prices due to basic supply and demand.
Looking in more detail, we see a wide range of value across individual projects, driven both by project production profiles and local congestion on the grid.
Below we dive into the drivers behind some of the wide-ranging values in the table above.
2. Congestion continues to be a revenue-maker or breaker.
One data point that should jump out in the above table is that the highest-value project of any renewables project in the country is a wind project in ERCOT West! While most wind projects within ERCOT West produced power worth comparatively little (the average real-time generation-weighted nodal price in 2020 was ~$10/MWh), the Notrees Wind Farm achieved an average nodal value of $56.60/MWh in 2020. Congestion in the first quarter, driven in part by oil and gas drilling in the Delaware Basin, drove the nodal price up for this West Texas wind project, causing entire months to average as high as $260/MWh.
The driver behind this price spike was localized congestion, which elevated prices at this particular location and suppressed them elsewhere. Coincidentally, the least valuable project in 2020 was also a wind farm in ERCOT West; it realized an average real-time LMP of less than $1/MWh in 2020.
Being on the right side of congestion will continue to be a key determinant to a project’s financial success.
3. Resilient projects lead with a competitive edge.
The fact that cold weather can cause wind farm outages due to the accumulation of ice on turbine blades is not new. Recently, images of iced over blades on non-generating wind turbines have flooded media outlets, but a similar event happened in late October 2020.
In late October 2020, an ice storm affected parts of Texas showing how projects that planned for extreme weather events are best positioned to take advantage of price spikes.
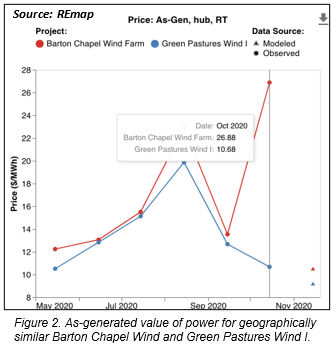
Several projects were forced to stop production during the ice storm due to ice accumulation on wind turbine blades. Projects that kept generating benefited from high wind speeds and elevated power prices, while projects that shut down earned little real-time revenue.
As a result, neighboring projects with a similar wind resource earned very different levels of merchant revenue. An example is shown above: the as-generated value of power generated by Barton Chapel wind farm at ERCOT North Hub was over 2.5 times than that of Green Pastures Wind, a wind farm located just slightly to the northwest.
Given that the market impact of the ice storm in October 2020 was tiny in magnitude compared to last month’s events, we expect that the recent cold snap drove even larger discrepancies in project value. Both the October ice storm and the February polar vortex underscore how projects that plan for extreme weather events and build resiliency into their systems have a competitive edge.
Given that high prices tend to correspond to extreme weather, clean energy buyers should also be aware that a project’s resiliency during these events has significant financial impacts — and should align incentives in their offtake contracts accordingly.
4. Texas summer price spikes were tame in 2020, but what of 2021?

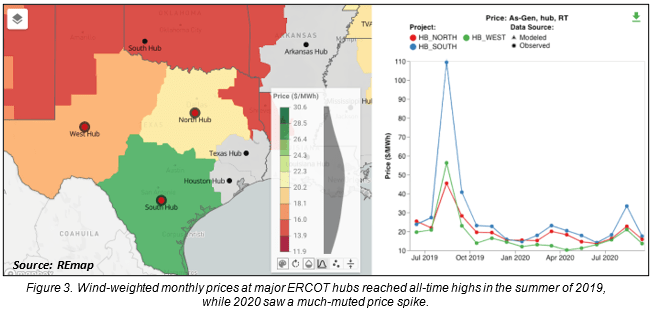
During the heatwave of the summer of 2019, the ERCOT market saw what was at the time unprecedented price volatility, with real-time prices reaching as high as $9,000/MWh for the first time in the market’s history. This was great news for renewable energy project owners and offtakers, so long as their project was generating during the handful of price spikes. The same is true during last month’s events, during which prices reached $9,000/MWh for days at a time.
As we detailed in the 2020 P99 Hedge That Wasn’t white paper, the situation was and will continue to be quite painful for any renewable energy project with a firm volume contract in place that did not generate enough energy to meet their firm volume commitments during price spikes.
By comparison, in the summer of 2020, the ERCOT market saw prices that were much lower than in 2019. In August, ERCOT West around-the-clock real-time prices averaged just $33/MWh in 2020, compared to $131/MWh in 2019. The value of both wind and solar projects in ERCOT West, similarly, dropped in August 2020: wind generation was worth just $24/MWh, and solar generation $52/MWh — a 70% and 80% reduction in value, respectively, from August 2019.
As a result, projects and offtakers that benefited from the prior year’s volatility had a much less profitable summer. For renewable energy projects with firm volume commitments, however, summer 2020 offered a reprieve from the pain of 2019 as lower weather-driven volatility resulted in more stable contract performance.
Last month’s events demonstrate that critical weather events are not isolated to one month or one season. Whereas 2019 saw summer spikes, 2021 has already seen record-breaking winter peak load records that resulted in new record-breaking prices in Texas.
We will all be watching the weather closely in 2021. This is particularly true for offtakers attempting to hedge market rate exposures and projects with fixed volume swaps, as they remain highly sensitive to price volatility and whether or not the sun is shining or wind is blowing during any exceptionally high-priced hours.
5. Wind energy prices at SPP North Hub bottom out during low-demand periods.
The average real-time value of wind generation at SPP North was worth $1/MWh over the entire month of November 2020. This record-low price point was driven by a combination of above-average wind speeds, below-average demand, and more than 1.6 GW of new wind build coming onto the grid in 2020.
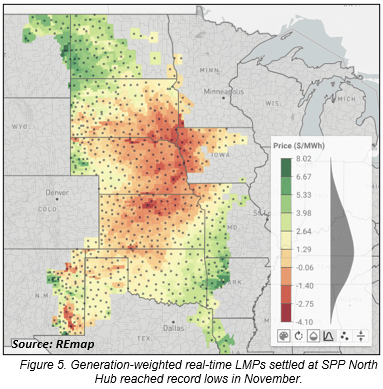
The graphic above shows that the value of wind generation was in fact well below $0/MWh in many locations across the ISO, if settled in the real-time at SPP North Hub.
This low price month stands in sharp contrast with the events of last month, where prices were regularly in the hundreds or thousands of dollars as cold gripped much of the region.
With more than 3 GW of additional wind capacity planned to come online in 2021 in the SPP ISO, we will be watching to see if record low generation-weighted prices continue during periods of low demand.
6. Solar in CAISO stabilizes after five years of shape decline.
After five years of consistent degradation in shape scalar (the ratio between the as-generated value of power and the around-the-clock value of power), CAISO solar projects bounced back in 2020 with a slight uptick in value.
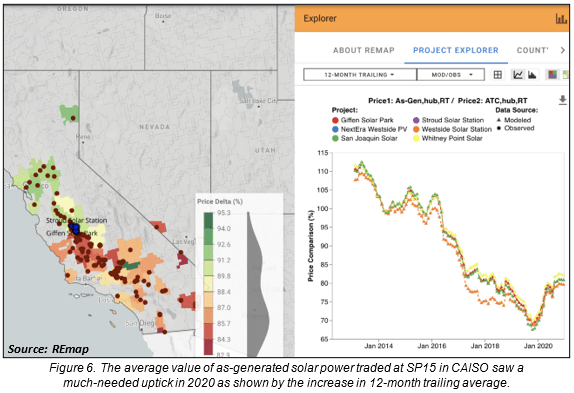
While solar shape remained near record lows of around 80% of the ATC price, this is a material uptick from the prior year’s value, which for many California solar projects was below 70%. The increase is attributable in part to price spikes that were concurrent with solar generation during the heatwave in August.
Going forward, we will be watching the California solar value closely as hundreds of MWs of battery storage capacity come online in 2021 and increase the grid’s ability to shift solar generation away from the hours of abundant sunshine.
7. Basis in SPP is a less sore subject.
Basis, or the difference between the LMP at the project node and at the relevant hub, is a significant contributor to a project’s bottom line. Historically, wind projects in SPP have struggled with significant basis impacts to revenue, with nodal LMPs often spending many hours at or below zero.
In 2020, the average as-generated basis cost for wind projects in this area was $3/MWh, meaning that on average over the year market price at the project’s node was $3/MWh lower than the relevant hub price when weighted by project generation. This is a significant improvement from years prior, in which basis costs reached as high as $20/MWh.
While 2020 saw node-to-hub basis improve across SPP wind projects, it’s unclear whether this trend will continue. Developers that site their projects in locations that minimize basis risk or that employ downside-protection options will be best positioned for long-term success.
Reposted as in Utility Dive.
Return to the blog posts main menu.