In this analysis, we’ll take a closer look at the project-level hourly performance data and seek to identify key trends and takeaways from that granular dataset. We’ll focus on wind projects, as solar projects were widely known to have performed or overperformed relative to expectations.
Until recently, comprehensive granular data about which individual power plants were generating during the February deep freeze in Texas didn’t exist. As a result, most analysis to date has focused on aggregate fleet performance (such as our analysis of wind and solar performance given local weather conditions) or the meteorological conditions that caused the event. While limited project outage information was available from ERCOT, the hour-by-hour performance of each plant had not been made public – until now.
Hourly project-level generation data is released by the Texas grid operator on a 60-day lag, which means that February information was just released recently. Each month, our market intelligence tool REmap processes this data from the grid operator, making it easy to visualize and assess project-level performance with a couple of clicks.
In this analysis, we’ll take a closer look at the project-level hourly performance data and seek to identify key trends and takeaways from that granular dataset. We will focus on wind projects, as solar projects were widely known to have performed or overperformed relative to expectations.
This article analyzes the performance of wind projects in all of ERCOT. For individual project consultation and to understand what the February 2021 event means for your projects, either in development or already operating, speak to our REmap team today.
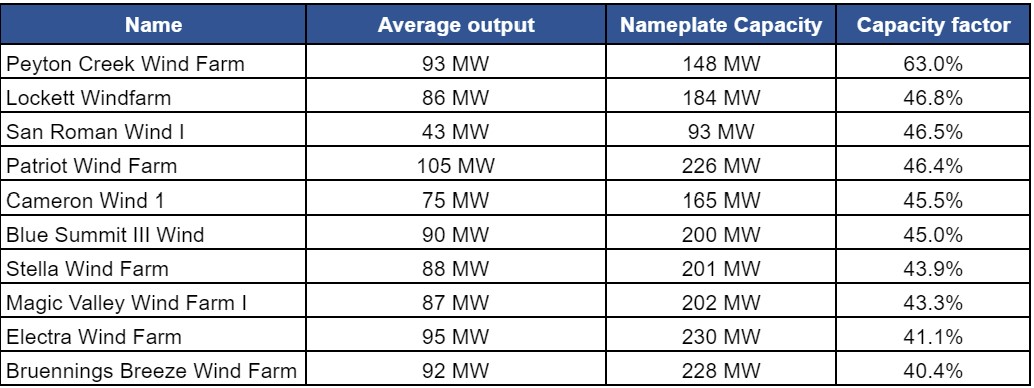
Top Generators
To start, we want to highlight the high performing wind projects in ERCOT’s fleet. We’ll look at this by the project’s net capacity factor, that is, how much energy the project contributed to the grid adjusted for the size of the project. Here, we are focusing on performance during the deep freeze, so from February 11 through February 19.
Top Revenue Makers
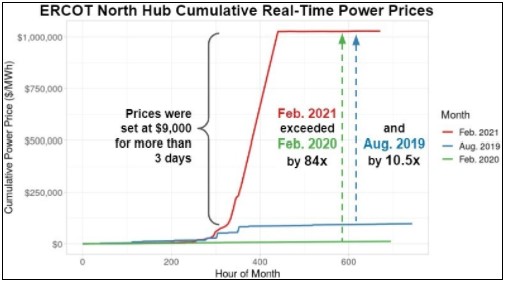
While generating essential megawatt-hours was critical to supporting the grid during the winter storm, another important topic is the financial impact of the event.
It is hard to overstate the impact of the February 2021 winter storm on power markets. Power prices were at or near $9,000/MWh for nearly 100 hours, leading to a cumulative price that was over 10 times that of the prior “extreme” market event in August 2019.
Overall, the financial “winners” were those projects that generated during the highest-price hours (the hours in which scarcity conditions elevated power prices). It is important to note, however, that the high value of generation during high priced events is often shared, in whole or in part, with the offtaker of the project as a result of contract-for-difference hedge settlements (in all its various flavors: vPPA, pgPPA, PRS, P99 Hedge).
Let’s look at the highest value projects across Texas at each major hub.

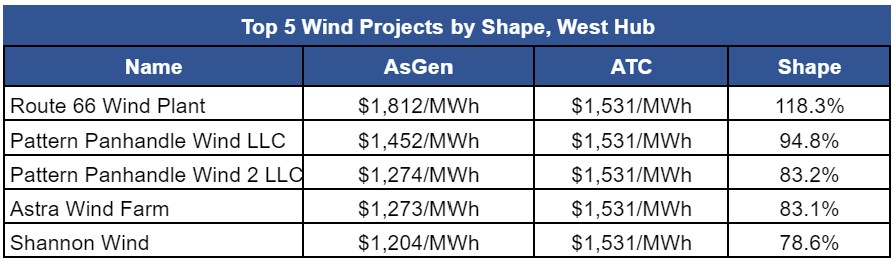
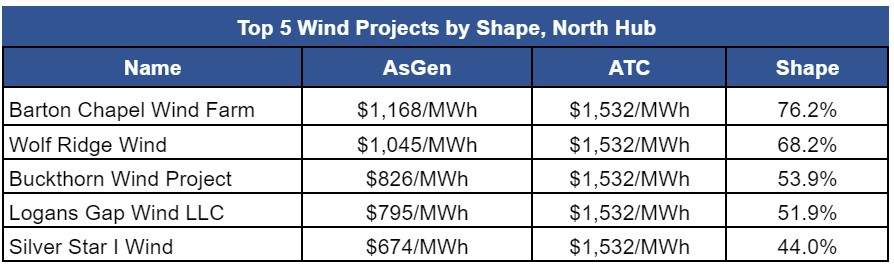
What’s common across Texas is that the around-the-clock (ATC) price of power in February 2021 exceeded $1,500/MWh. After that, what should stand out is that wind projects across South Hub were best-positioned to generate valuable energy and capture record-high prices. Projects at North Hub experienced a significant shape discount, while the best projects at West Hub experienced a more neutral shape relative to the around-the-clock (ATC) price.
The highest realized value was achieved by Peyton Creek Wind Farm, with a generation-weighted realized hub price that exceeded $2,000/MWh.
Congestion Impacts in ERCOT South
Not only did Peyton Creek Wind Farm benefit from valuable generation at the hub level, it also benefited from limited node-to-hub congestion (also known as “basis”). The project is located between Houston and Corpus Christi, with few wind projects nearby to compete for valuable transmission capacity. Many of the other highest-value ERCOT South wind projects are all located in a relatively congested area further south, and experienced materially worse grid congestion.
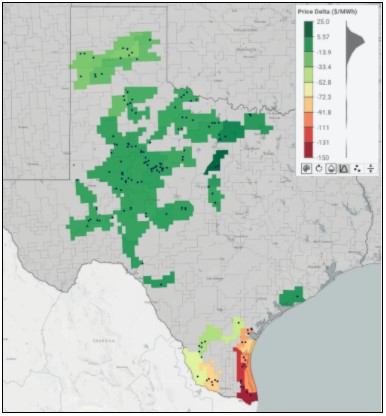
Figure 4 shows that basis impacts varied widely across the ERCOT region during the winter storm. Positive basis (dark green) indicates that a project observed a higher LMP at the project node than the price at the hub. This is generally in the project’s favor, as offtake agreements usually settle at a hub. Any positive basis then is upside for the project, while negative basis implies a loss for the project.
Although most of ERCOT experienced relatively minimal node to hub basis during the winter storm, projects in the ERCOT South region saw significant basis impacts. When wind speeds are high and projects are generating, it’s not uncommon for projects in South Texas to suffer from congestion-related impacts.
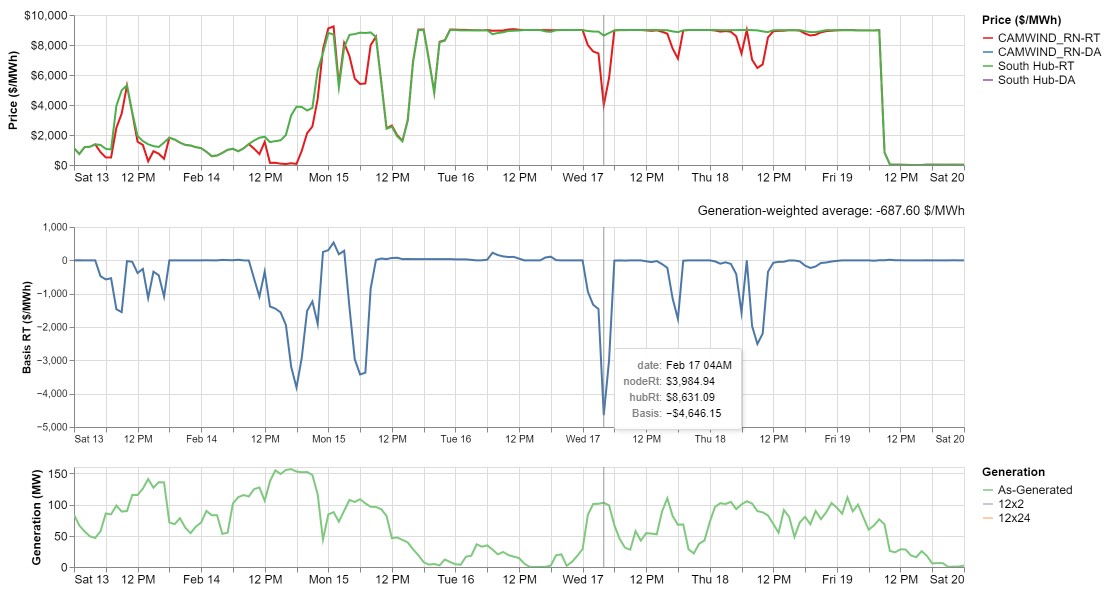
To understand what was happening in ERCOT South it is helpful to dive one level deeper. Figure 5 shows the hourly price and generation data for a coastal Texas wind project, Cameron Wind, that saw significant negative basis during the event. The middle chart highlights the difference between the nodal and hub price at one specific hour on February 17th — almost -$4,700 — and the bottom chart shows the observed hourly generation.
Unprecedented Variability
While coastal Texas wind projects fared the best (see Figure 3), there was considerably more variability in their financial performance in February 2021 than during past events. Figure 6 shows historical real-time shape in dollars per megawatt-hour from August 2019 to February 2021 for several wind projects along the coast of south Texas.
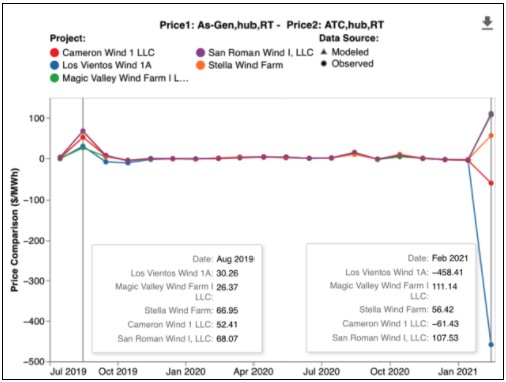
Figure 6 shows these projects all performed similarly during the extreme price event in August 2019, but diverged materially in February 2021. Several coastal Texas wind projects saw extreme negative shape values in February 2021, a dramatic divergence from the August 2019 event. The negative shape values are likely due to poor operating performance during high-priced periods.
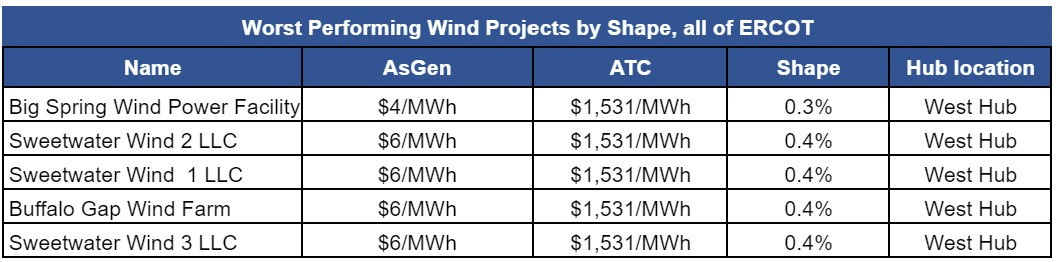
Poor Performers
The worst revenue and shape values were seen by the wind and solar projects that were offline for the duration of the high priced event. These projects were unable to generate — whether due to operating decisions, transmission constraints, or other reasons — when electricity was most in demand and power prices at their highest. (Analysis of hourly data shows, for example, that Big Spring Wind Power generated zero megawatt-hours between February 10th and February 19th.) As such, their generation-weighted value is significantly lower than the around-the-clock price of power at the hub. These projects were heavily concentrated in West Texas.
Learn More
The deep freeze in Texas was an unprecedented event in ERCOT’s history. Granular analysis of projects in the region gives visibility into which projects benefitted from the period of extreme market conditions and which projects didn’t. Going forward, as the focus of generators and policy-makers alike shifts towards resilience, having visibility into this performance data will become more important than ever.
REmap is REsurety’s market analytics platform, an interactive tool that allows users to quickly and accurately understand the impacts of weather and power markets on the value of renewable energy projects. To learn more, visit resurety.com/remap or contact us at [email protected].
A similar version of this post appeared in Windpower Monthly.
Return to the blog posts main menu.